NOT PRESENTLY RUNNING
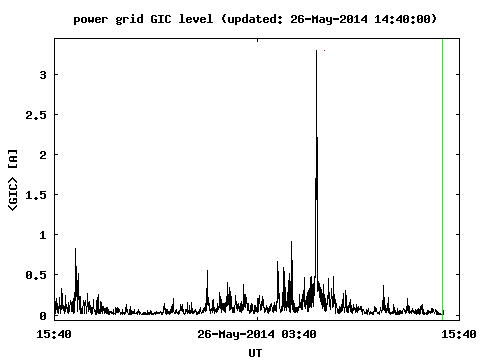
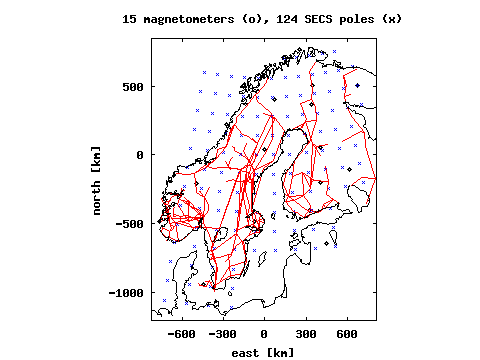
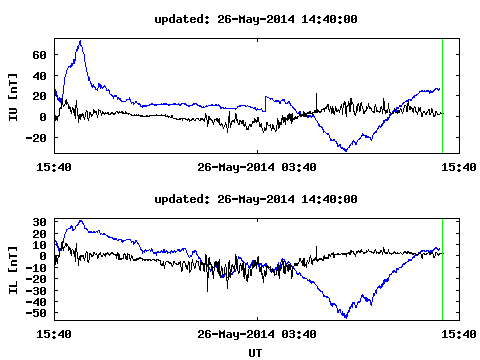
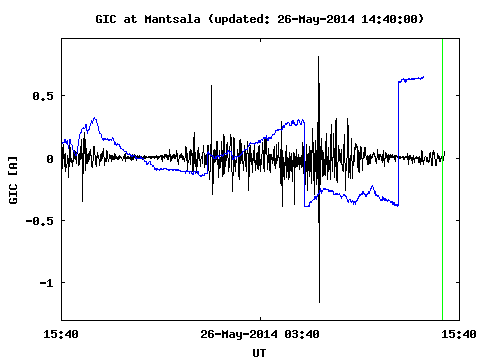
Results shown here are based on the software applied in the EURISGIC and ECLAT projects, and in the Solar Shield. Simulated data of the latest 24 hours are used from the magnetometer stations shown on the map. The ionospheric equivalent current system is determined from the horizontal field components. Then the magnetic field is interpolated at the nodes of the simplified model of the Nordic power grid (339 nodes). The electric field at the nodes is calculated using the ground conductivity models provided by GGRI. Finally, GIC is computed at the nodes, and their sum divided by the number of nodes roughly describes the GIC activity level. Red colour denotes periods when the sum belongs to the top 0.1% of all values (exceeding 994.8 A in the whole grid), based on model statistics in 1996-2008. The green line shows the time when the plot was created. The special case of Mäntsälä is based on separate modelling of the natural gas pipeline (black: modelled, blue: measured).
The research leading to these results has received funding from the European Community's Seventh Framework Programme (FP7/2007-2013) under grant agreements no 260330 (EURISGIC) and 263325 (ECLAT).
Comments to Ari Viljanen (at fmi.fi).