M.T.Syrjäsuo (1),
T.I.Pulkkinen (1),
P.Janhunen (1),
A.Viljanen (1),
R.J.Pellinen (1),
K.Kauristie (1),
H.J.Opgenoorth (1,2),
S.Wallman (1,2)
P. Eglitis (1,2),
P.Karlsson (2),
O.Amm (3),
E.Nielsen (4),and
C.Thomas (5)
(1) Finnish Meteorological Insitute, Helsinki, Finland
(2) Swedish Institute of Space Physics, Uppsala, Sweden
(3) Institut für Geophysik und Meteorologie, Technische Universitä
Braunschweig, Germany
(4) Max Planc Institut für Aeronomie, Katlenburg-Lindau, Germany
(5) Department of Physics and Astronomy, Leicester University, UK
AbstractThe recently completed Magnetometers - Ionospheric Radars - All-sky Cameras Large Experiment (MIRACLE) is a two-dimensional network of instruments in Northern Fennoscandia and Svalbard, which monitors mesoscale variations in the auroral ionospheric dynamics. Five newly implemented digital all-sky cameras form an important part of the network. On Nov 3, 1997, the network recorded a small pseudobreakup at 2211 UT, which lasted only a few minutes before the disturbance decayed. We show that the auroral activation was associated with a current vortex and a strong electric field poleward of the auroral activity. Following the breakup, a substorm onset occurred at about 2242 UT to the west of Scandinavia. The MIRACLE chain recorded the expansion of the eastward edge of the auroral bulge and a downward field-aligned current well poleward of the auroral activity and the most intense electric field. We discuss the implications for ionosphere--magnetosphere coupling that can be concluded from a detailed instrument network such as MIRACLE. IntroductionThe Magnetometers - Ionospheric Radars - All-sky Cameras Large Experiment (MIRACLE) is a two-dimensional instrument network constructed for mesoscale studies of auroral electrodynamics, which, with the exception of EISCAT, is maintained and operated in collaboration between the institutes listed in the list of authors under the leadership of the Finnish Meteorological Institute. The network covers an area from subauroral to polar cap latitudes over a longitude range of about two hours of local time. The various instruments have different spatial resolutions, but basically the network is designed for studies in the spatial scales from a few tens of km upward. In the following we will show that the size of the instrument network is suitable for a variety of auroral and magnetospheric studies: The initial current system at substorm onset covers about 500 km in longitude [Baumjohann et al., 1981], and pseudobreakups [ Pulkkinen, 1996] or other localized auroral forms [Opgenoorth et al., 1994] are often in the scale size that can be recorded with a single all-sky camera (<600 km). Furthermore, the network can be used to monitor the motion of larger-scale structures, such as the westward traveling surge or the eastward expanding auroral bulge. The International Solar Terrestrial Physics program is designed to study the solar wind - magnetosphere - ionosphere interactions. Several spacecraft are in orbit that monitor the key regions in these processes: the Sun and the upstream solar wind, magnetotail processes, and auroral phenomena. Whereas the global picture of the substorm evolution is now rather generally accepted [ Baker et al., 1998], there are a number of missing pieces of information that finally will answer detailed questions such as exactly when substorms will occur or how large the disturbances will be. For these questions, it is necessary to include the mesoscale ionospheric processes, which all can be monitored and examined using the MIRACLE network, planned to be operative until 2004. InstrumentationIMAGE Magnetometer NetworkThe IMAGE magnetometer network consists of 19 fully calibrated magnetometers, and provides three-component measurements of the total geomagnetic field at 10-sec resolution [Viljanen and Häkkinen, 1997]. Coherent and Incoherent Scatter RadarsThe STARE bistatic radar system records the two-dimensional horizontal E-region plasma flows over northern Scandinavia. The CUTLASS radars, which comprise two components of the SuperDARN network overlooking Scandinavia [Greenwald et al., 1995], record the larger-scale convection in the E and F-region. Finally, the EISCAT radars provide more detailed looks and altitude dependence of several ionospheric parameters simultaneously in a localized region over Tromsř. All-sky camera networkFinnish Meteorological Institute (FMI) started continuous auroral recordings on color film at four stations in Finnish Lapland in 1973. The cameras operated every clear night every year between August and April, most regularly at Kilpisjärvi, Kevo, Muonio, and Hornsund (Svalbard). During the last twenty years FMI has collected over 2.2 million auroral images, which makes it possible to study auroral activity over almost two sunspot cycles. |
New digital all-sky cameras were tested during 1995-1996, and based on the prototyping results six units were manufactured. The all-sky imagers were manufactured by Keo Consultants, whereas the complete computer setup was designed, built, and programmed at FMI. A new all-sky camera station consists of an imager with a 7-position filter wheel, a station computer, and housekeeping electronics such as uninterruptible power supply. The digital all-sky cameras have completely replaced the old film cameras, and presently five stations are in operation. The new stations operate autonomously taking images whenever it is sufficiently dark (in Svalbard winter, 24 hours-a-day). The images are stored in a local hard disk for future transfer to FMI. Keograms - time vs latitude quick-look data - are transferred to FMI every noon from every station, and are available for analysis the same day.
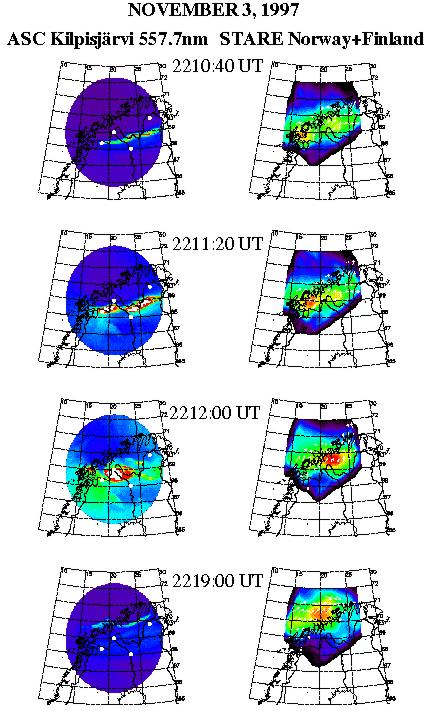
Observations on Nov 3, 1997
Both activations are clearly visible in the data, the poleward expansion of the westward electrojet is associated with the arrival of the eastward edge of the substorm current wedge over Scandinavia. The next panel shows the backscatter intensity recorded by the STARE radar (in Norway) that is a function of the E-region electron density and electric field, amongst other factors [ Kustov et al., 1993]. The bottom panel shows the electron density from the EISCAT UHF radar located in Tromsř. The E-region electron density is directly related to energetic particle precipitation. Pseudobreakup during the growth phase
Eastward expanding auroral bulgeAfter the pseudobreakup quieted, the growth phase continued for another 30 min, and the substorm onset occurred at about 2242 UT to the west of the MIRACLE chain, which at that time was in the 0200 MLT local time sector. POLAR images from the UVI instrument showed an onset over Iceland and its expansion to the Scandinavian sector (data not shown). The expansion of the bulge to the MIRACLE field of view caused an intensification of the auroral activity, intensification and rotation of the equivalent current vectors, and an enhancement of the electric field and plasma flow. More detailed comparisons reveal that there was a clear spatial ordering of these activations: The downward field-aligned current was located between Svalbard and the Scandinavian coast. The electric field enhancement was strongest close to the coastline well equatorward of the current and did not maximize near the northern edge of the field of view; unfortunately the STARE field of view does not cover the region of strongest downward current. The POLAR images show that the region of the downward current was almost void of auroral activity. The ASC observations from Kilpisjärvi confirm this observation: the data show an auroral activation from the west, which decayed to diffuse and relatively weak auroral activity by 2305 UT. These observations will be discussed in more detail elsewhere. |
DiscussionThis paper has briefly described the wealth of ground-based observations available from a substorm event on Nov 3, 1997. The observations covered a small pseudobreakup and a following substorm expansion. During the pseudobreakup the magnetometer, STARE and EISCAT data indicate a localized upward FAC current filament within the breakup arc. Within this current region the precipitating particle energy is only around 10 keV, as estimated from the lower boundary of the EISCAT electron density measurment. This indicates relatively weakly accelerated magnetospheric electrons as the source for the auroral activation and the magnetic disturbance, both originating from the inner magnetosphere (inside 10-15 RE). The eastward expanding auroral bulge reached the Scandinavian sector a few minutes after the substorm onset. STARE showed enhanced electric field intensity poleward of the auroral activity, and the field-aligned current was located poleward of the auroral activity. This is an important point for the conjugate tail-ionosphere observations: the region of auroral brightening in this case is not conjugate with the source region of the field-aligned current; the former is triggered by precipitating electrons equatorward/Earthward of the downward current region [Opgenoorth et al., 1994]. Another key question that can be addressed with this network is the current carriers of the downward current: the tail ions are much too slow for balancing the upward current carried by the downward precipitating electrons [Pellinen et al., 1995].
MIRACLE data are available in World Wide Web at |
References
|