Quicklook plots for 2D Equivalent Currents
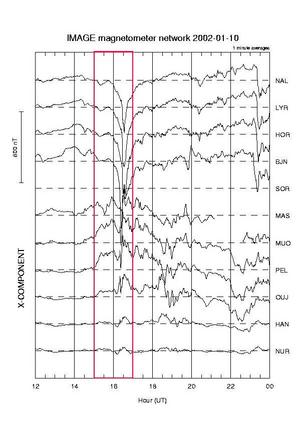
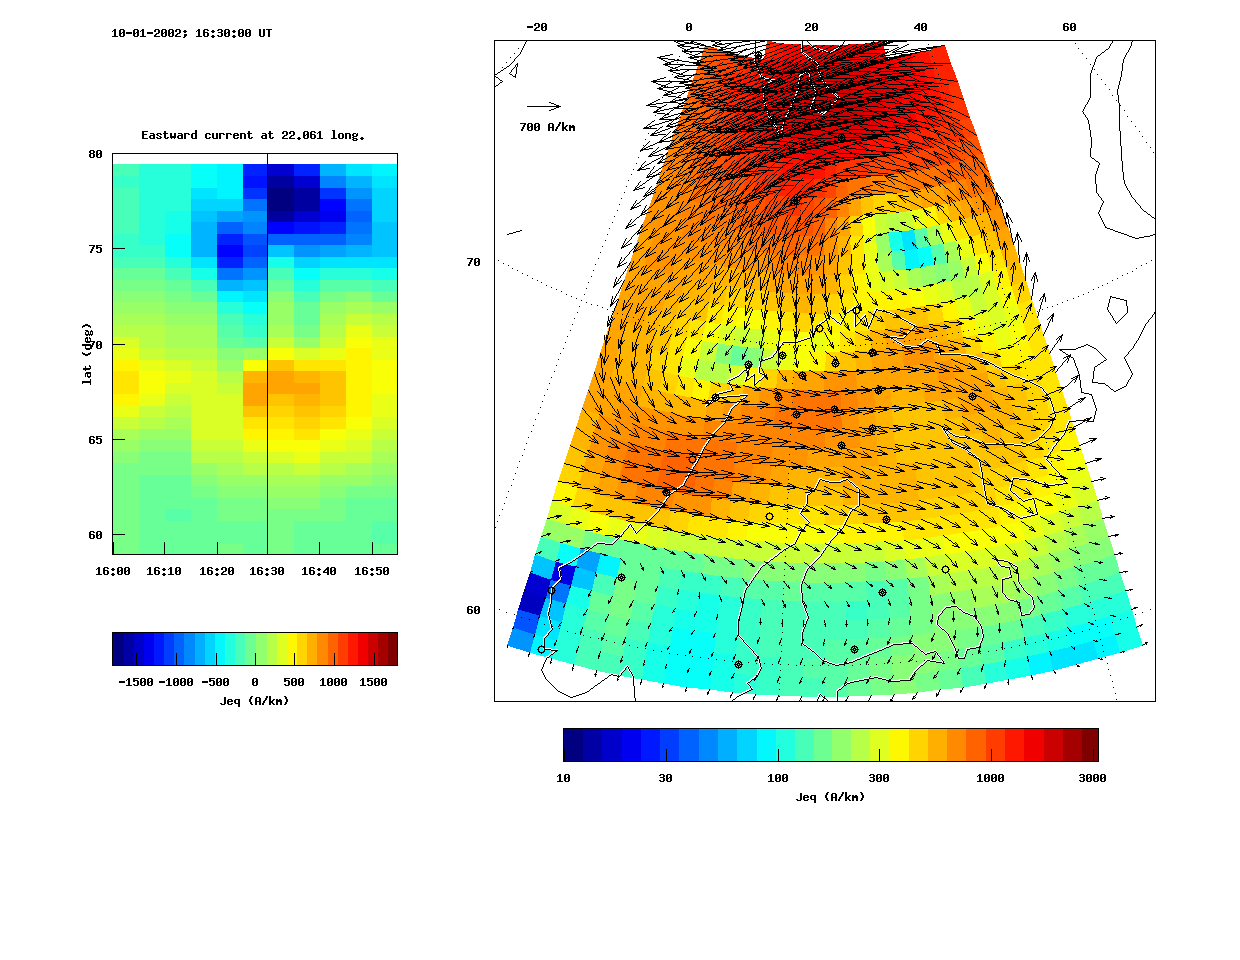
| From ground magnetometers the ionospheric equivalent currents can be calculated. These are currents that flow only within the ionospheric plane (assumed at 100 km altitude) and cause the same magnetic field on the ground as the actual ionospheric current system (which may be three-dimensional). So please note: Ionospheric equivalent currents are not necessarily equal to the actual currents! The results are displayed as arrow plots, which show the equivalent current in a grid between 59 and 79 degrees latitude and 3 and 42 degrees longitude. The absolute values of the currents are by default also shown as colours (logarithmically scaled); if you do not want this, you can uncheck the box "Use colours". The magnetometer stations from which data are used in the calculation are shown as black filled circles; the ones which are not operational at any given time are shown as open circles. A plot is given for every sample of the event period requested. Also, a second plot shows the time evolution of the equivalent currents along a north-south profile, for the entire period, with a line indicating to which point in time the arrow plot corresponds. After pressing "Go!", the user will be presented with the plot for the first point in time of the event period requested. Other samples can be viewed using the various "tape deck" buttons provided. Please note that each sample plot takes about 10 seconds to produce. After the first plot becomes ready, it will be presented to the user, while the software continues producing the other ones in the background. Hence, if the user immedately wants to see the last plot of the period, this is not likely to be ready yet, but a little while longer (depending on the number of sample points in the period) it will be. To scale the magnetic data, you need to give a baseline period, i.e. magnetically quiet period close to the event you are going to analyse. If, after selecting an event period, you click "Get default", the form automatically selects the entire day of the start of the selected event period. This is usually a good guess. However, you can still modify it if you know better. To find a good quiet period, you can use the IMAGE User defined magnetograms. Please report any disturbances in the functioning of this page to Max van de Kamp at FMI.
|


