SISTED plots
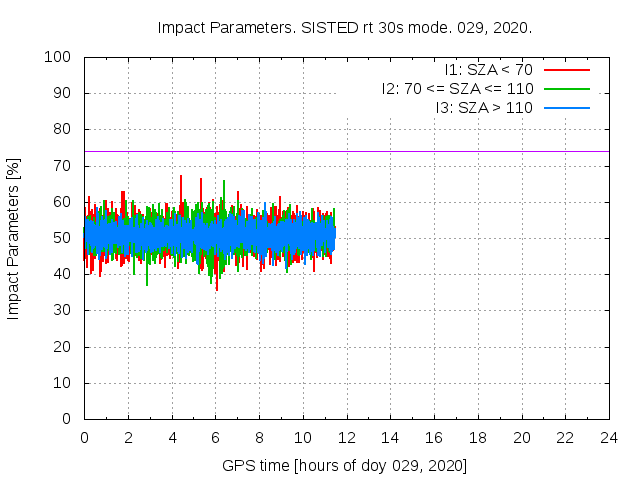
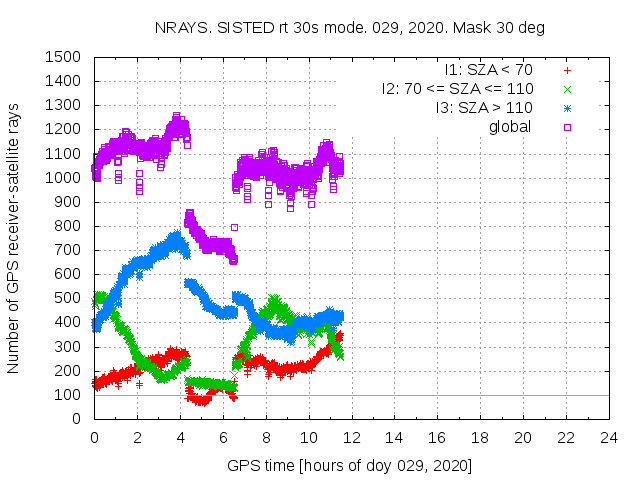
SISTED generates two plots in Near-Real-Time (NRT) which are available in the links below. A solar flare has been detected during the on-going day if the red curve in Plot 1 exceeds 74 % (magenta horizontal line). This detection can be considered reliable if the numbers of GPS rays available for the product are more than 100 in Plot 2. The time axis in these plots is given as GPS time, which is 17 s ahead of UTC (year 2016). Plots 1 and 2 are updated in this service once per minute.

