Note: images are also links
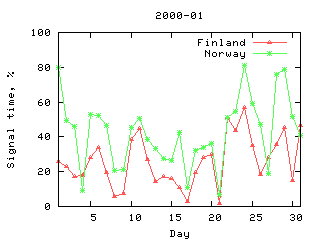
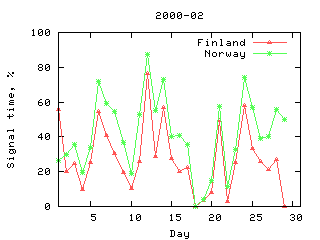
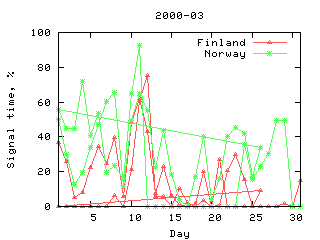
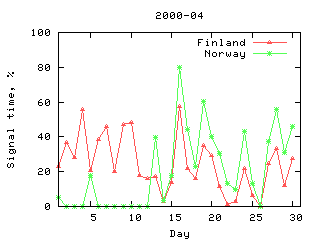
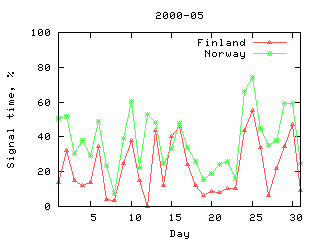
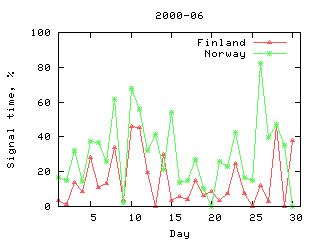
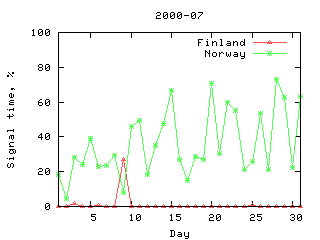
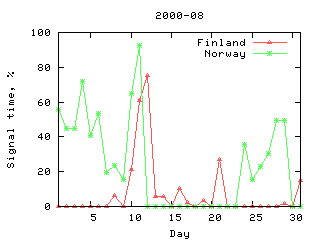
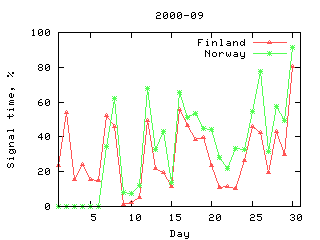
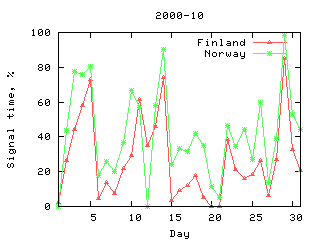
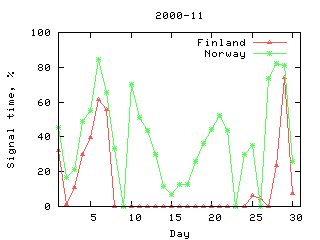
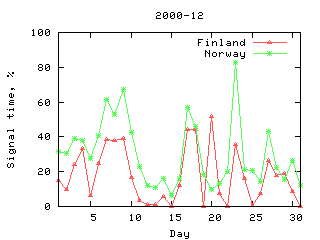
The chart is based on the RTI plots. It gives the percentage of time when the radar detects backscatter over at least 25 % of the range. Very short events are not counted.