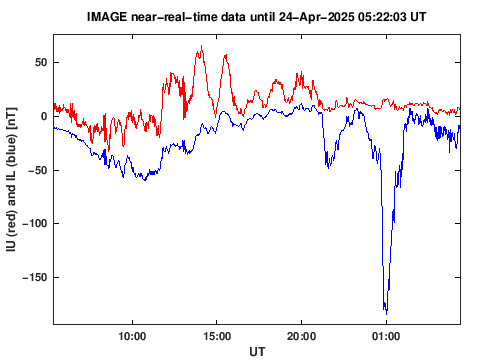
Geomagnetic recordings of the latest 24 hours from a subset of the IMAGE magnetometer stations are used to calculate the geoelectric field from which GIC is computed.
Top left panel: Maximum and minimum northward magnetic variation field.
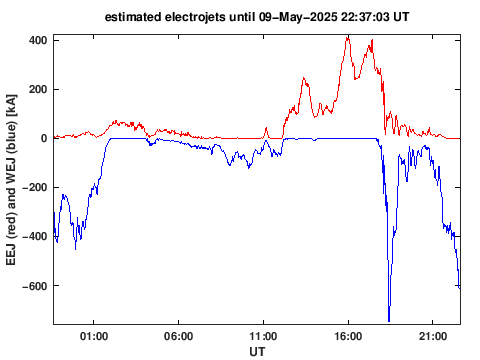
Centre left panel: Estimated eastward and westward ionospheric electrojets across Finland.
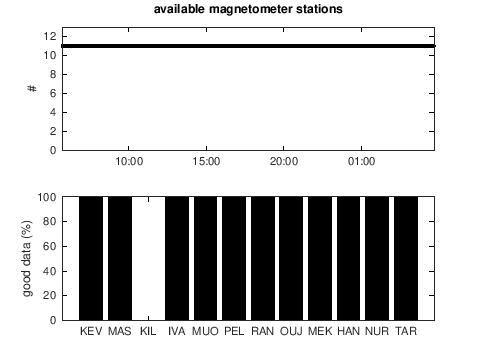
Bottom left panel: Info about available magnetometer data.
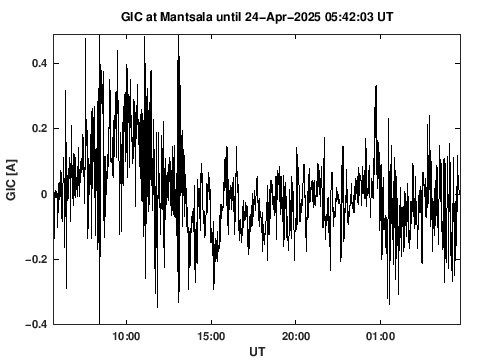
Top right panel: Modelled GIC in the Finnish natural gas pipeline in Mäntsälä.
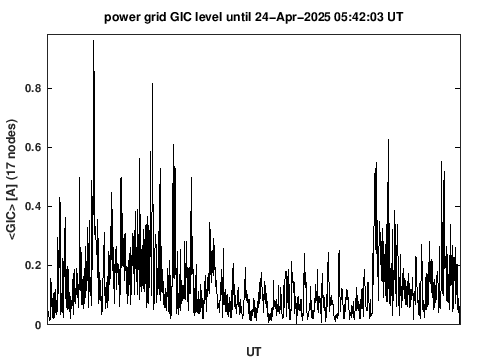
Centre right panel: Modelled sum of GIC in the Finnish power grid divided by the number of nodes (configuration of 1978).
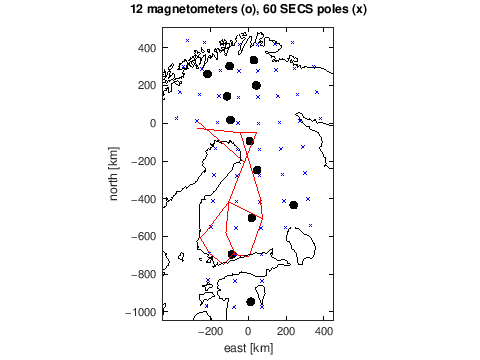
Bottom right panel: Schematic map.
There is only a rough automatic quality control on these results, so errors can appear. Cyan dots refer to time steps at which data from less than half of magnetometer stations are available.
The plots are created automatically every 5th minute. We do not guarantee an uninterrupted availability.
In the GIC plot of the Finnish grid, red colour appears when the sum belongs to the top 0.1% of all values (exceeding 5.5 A per node), based on model statistics in 1996-2008. Note that this is just an indicative measure of GIC activity, since the present grid is much more complicated. Similarly, red colour appears for the modelled GIC in the pipeline when it belongs to the top 0.1% (exceeding 3.94 A).
IU and IL are also available as a text file.
Results shown here are based on the software applied in the EURISGIC and ECLAT projects. Ground conductivity models are provided by the MTA Research Centre for Astronomy and Earth Sciences.
For details of the modelling method, see
Viljanen, A., R. Pirjola, M. Wik, A. Adam, E. Pracser, Ya. Sakharov and Yu. Katkalov, 2012: Continental scale modelling of geomagnetically induced currents. J. Space Weather Space Clim., 2, A17, doi:10.1051/swsc/2012017 (Open Access).
The power grid model uses parameters which were valid in the end of 1970's. For details, see
Pirjola, R. and M. Lehtinen, 1985: Currents produced in the Finnish 400 kV power transmission grid and in the Finnish natural gas pipeline by geomagnetically-induced electric fields. Ann. Geophys., 3, 485-491.
The research leading to these results received funding from the European Community's Seventh Framework Programme (FP7/2007-2013) under grant agreements no 260330 (EURISGIC) and 263325 (ECLAT). Fingrid Oyj and Gasum Oy are acknowledged for their long-term contribution to FMI's GIC research.
Comments to Ari Viljanen (at fmi.fi).