This recent paper, which describes the model and discusses the physical meaning of the results, was given at ESA 1996 Symposium on Environment Modelling for Space-based Applications, which was held in Sept. 18-20 1996 in ESA/ESTEC, Noordwijk, The Netherlands.
This HTML file, and the other HTML files, concentrate on color figures and animations, with little explanation. To get the maximum out of these pages, read the abovementioned paper simultaneously.
General rule: Click the figures to animate or enlarge them
 Click to magnify (37 KB)
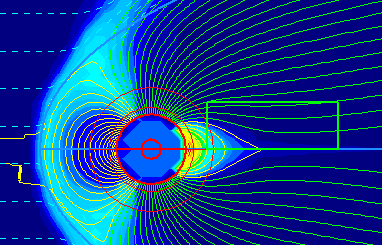
This figure shows the solar wind plasma streamlines (blue lines), closed (yellow) and open (green) magnetic field lines, as well as the pressure distribution in rainbow-coded color. The enlarged figure shows also the scale of the pressure. The green box shows the size of the older GUMICS-1 simulation box.
 Click for QuickTime animation (8.5 MB).
An MPEG animation (840 KB) is also available.
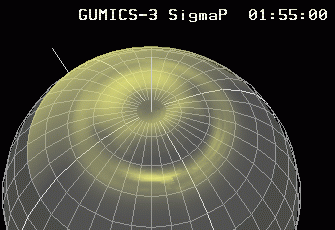
The ionospheric Pedersen conductivity is shown here as a QuickTime animation (8.5 MB). The color coding starts from transparent black at 0 mho to nontransparent bright yellow at 12.5 mho. From 12.5 to 25 mho the color changes from yellow to basic white.
 Click for QuickTime animation (5.1 MB).
An MPEG animation (840 KB) is also available.
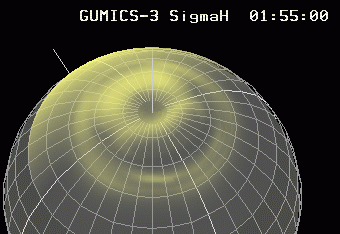
The ionospheric Hall conductivity is shown here in similar fashion. The color coding is the same as in the Pedersen conductivity animation.
 Click for QuickTime animation (6.4 MB).
An MPEG animation (860 KB) is also available.
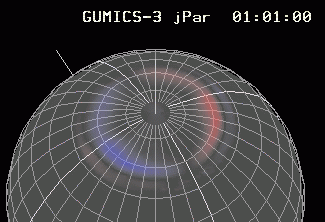
The field-aligned current (FAC) pattern is shown here in similar fashion.
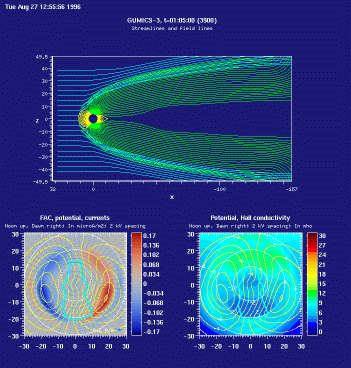 Click to enlarge;
QuickTime animation (5.1 MB) is also available.
The upper panel shows the solar wind plasma streamlines (blue lines) as well as closed (yellow) and open (green) magnetic field lines. The lower panels show the northern hemisphere ionospheric plane. The field-aligned current (FAC; blue is upward and red is downward), electric potential contours (yellow) and horizontal current (blue arrows) is shown on the left panel. The right panel is the ionospheric Hall conductivity, along with the same electric potential contours as in the left panel.
The thick blue curve which encircles the magnetic pole is the open/closed field line boundary. When the IMF Bz is negative (southward) [this happens when t is between 1h and 2h], the open flux area (polar cap) expands, almost reaching the Region-1 FAC. When IMF Bz is positive (northward), the polar cap shrinks. See the IMF Bz input for more details.
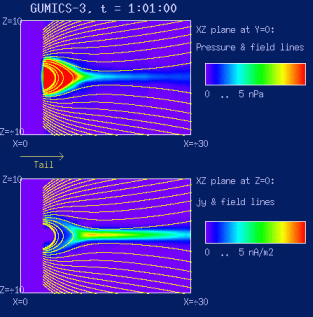 Click to enlarge;
QuickTime animation (11.6 MB) is also available
The upper panel shows a color-coded pressure in the midnight meridian plane (Y=0 plane) in the near-Earth magnetotail, together with magnetic field lines. The lower panel shows the Y component of the current density (the cross-tail current). Data on the earthward side of X=-5 plane are not shown (only blue background appears on this space).
Other groups who are doing global MHD (and who are visible in the Internet): Tamas Gombosi's group in Ann Arbor/Michigan/USA; Nagoya University in Japan; Steven Zalesak at NASA/Goddard Space Flight Center; Robert Winglee and Ron Elsen at Seattle/Washington/USA.
27 Oct 2000, Pekka Janhunen (First.Last@fmi.fi)