• All FMI products
• Main aurora page • All-sky camera images • Information • References • Acknowledgements • Archive
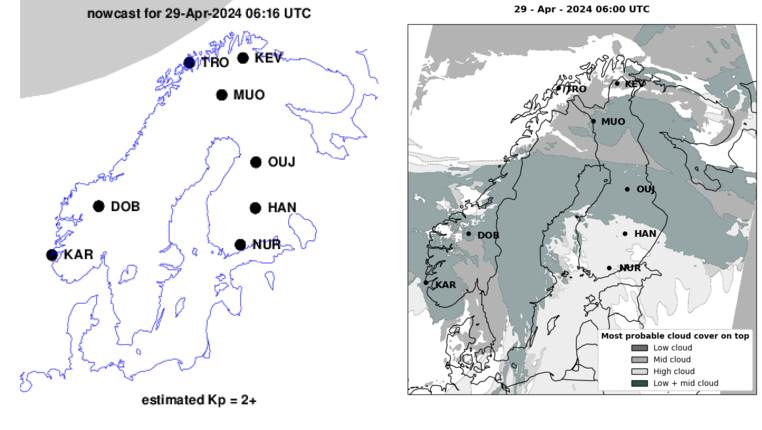
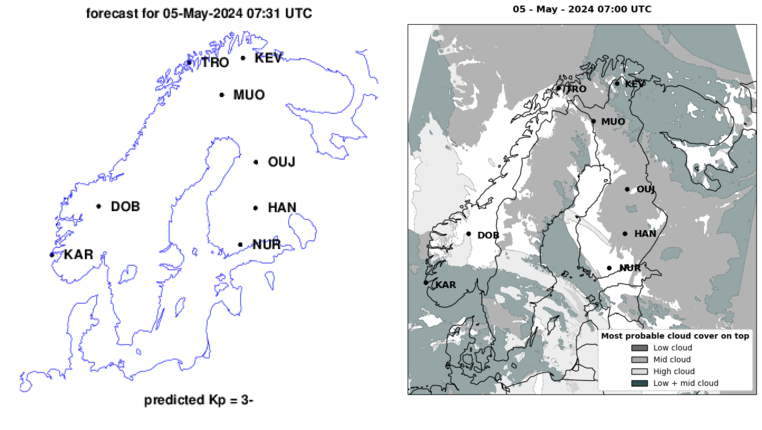
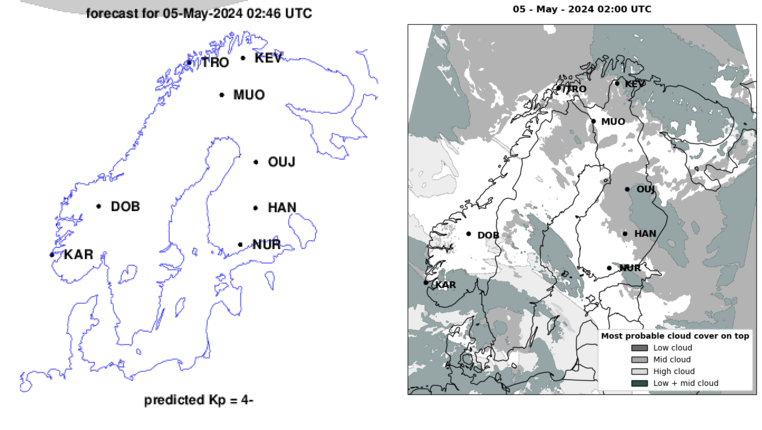
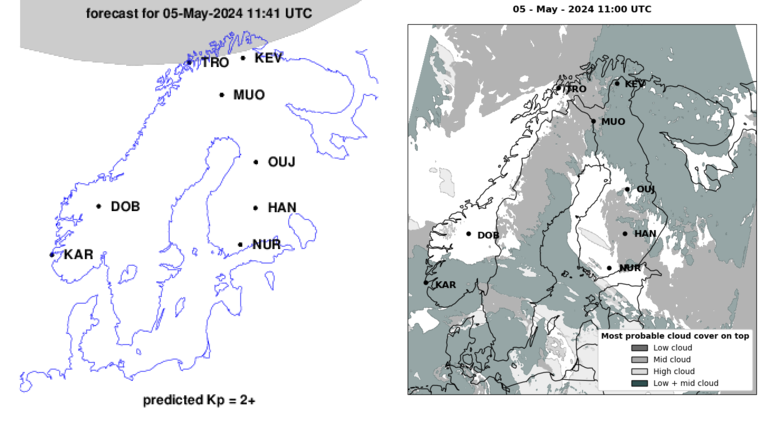
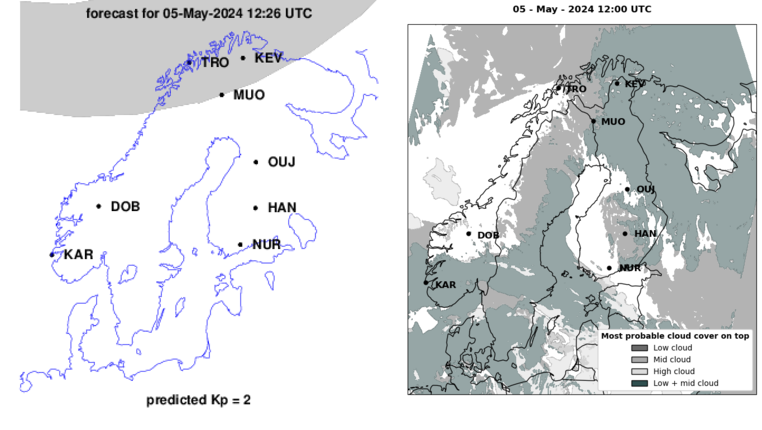
The plot labelled as "Now" shows the present situation. The green zone (if any) indicates the auroral oval estimated by magnetometer recordings. Other plots show forecasts for which green indicates a high probability of auroras and light green refers to a smaller probability. In case of low activity, we use an empirical oval drawn with a grey colour. Cloudiness maps are based on FMI weather forecasts.
14.05.2026 20:26:14 UTC, rise and set times in local time
| station | STA | max_dB | activity | sunrise | sunset | moonrise | moonset |
| Tromsø | TRO | 0.14 | 0 | 01:52 | 23:37 | 02:28 | 19:26 |
| Kevo | KEV | 0.10 | 0 | 02:16 | 23:58 | 02:53 | 19:53 |
| Muonio | MUO | 0.10 | 0 | 03:18 | 23:30 | 03:16 | 19:50 |
| Oulujärvi | OUJ | 0.03 | 0 | 03:56 | 22:21 | 03:17 | 19:07 |
| Hankasalmi | HAN | 0.03 | 0 | 04:20 | 22:00 | 03:27 | 18:57 |
| Dombås | DOB | 0.02 | 0 | 04:32 | 22:09 | 03:37 | 19:14 |
| Nurmijärvi | NUR | 0.03 | 0 | 04:42 | 21:54 | 03:40 | 18:56 |
| Karmøya | KAR | 0.02 | 0 | 05:09 | 22:03 | 04:01 | 19:14 |
Previous full Moon: 01.05.2026 - Next new Moon: 16.05.2026
The table shows the maximum 1-min time derivative (dB/dt) of the magnetic field (north or east component) at a few magnetometer stations during the latest hour. The unit is nT/s. The activity codes are defined as follows:
0: auroras unlikely seen at the station (black dot on the first map)
1: auroras likely (red dot)
2: data missing (white dot)
They are empirically determined based on the maximum dB/dt. Sunrise, sunset, moonrise and moonset are given at an accuracy of a few minutes. If the Sun is shining then the auroral oval just indicates the region where increased geomagnetic activity is probable. N/A: no rise or set time. Sun above the horizon all the time: +; Sun below the horizon all the time: -.
This page is automatically created. There is only a simple automatic quality check of magnetometer data, and we cannot guarantee an error-free service.