• All FMI products
• Pipeline main page • Information • References • Acknowledgements • Archive
The purpose of this product is to give a general overview of GIC activity in the area of the Finnish natural gas pipeline. GIC and pipe-to-soil voltage are calculated from the following input: recent geomagnetic field recordings, ground conductivity model and pipeline model. The modelled 1-min value is considered to be large when it exceeds a threshold (3.94 A) corresponding to the top 0.1% of all values in long-term statistics in 1996-2008. This is indicated in the plots by red colour. The modelled pipe-to-soil voltage does not take into account the effect of the corrosion protection system. Cyan dots on the time axis refer to time steps at which data from less than half of magnetometer stations are available.
Note: GIC recordings were stopped on 23 Oct 2023 due to a persistent noise problem. The next paragraph is shown only to describe how the measurements were performed.
The measured value shown here as 1-min average is based on magnetometer recordings. There is one instrument just above the pipe in Mäntsälä and another reference instrument at the Nurmijärvi observatory about 40 km from Mäntsälä. The magnetic field above the pipe is the sum of two terms: the natural variation and variation due to GIC flowing along the pipeline. At Nurmijärvi, the field is only due to natural variations. Since the distance between the two sites is quite small, the natural variation is assumed to be equal at both locations. Subtracting the field at Nurmijärvi from the field above the pipe gives the field caused by GIC. Using the Biot-Savart law the current along the pipe can then be calculated. There is occasional noise of about up to 1 A in the measured GIC.
Archive of GIC recordings in the Finnish natural gas pipeline is available at
https://space.fmi.fi/gic/
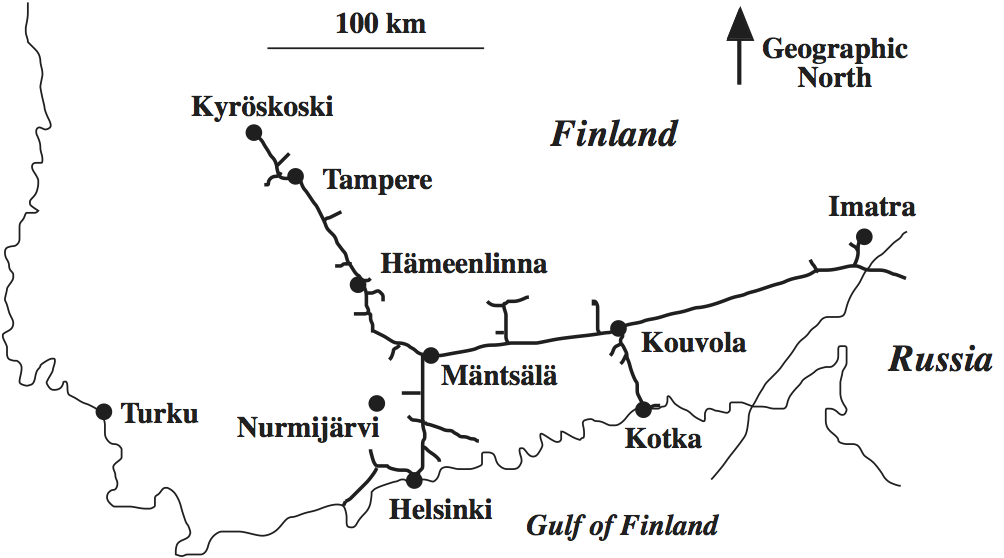
Schematic map of the natural gas pipeline: