Digitization of yearbook data tables
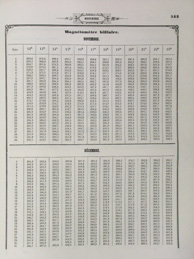
Figure 1. An example of a single page containing two data tables. The page is for H-component (Magnétométre bifilaire) from the observatory Nertchinsk November and December 1854 showing data from 12 h to 23 h (Göttingen time). The column on the left gives the dates. Hours are shown on the upper row. Other columns give observed instantaneous hourly values of H in units of 1/24 inch (roughly 1 millimeter) taken from the scale.
The current study covers the years 1850-1862. For these years the format of the yearbooks and data tables are same for all years. Each page of the observatory yearbooks contains data from two months arranged in rows and columns as depicted in Fig. 1. The left hand pages contain data for hours 0-11 and the right hand side pages for hours 12-23. Each page was photographed using a pocket digital camera which produced jpg files with resolution of 2592 x 1944 pixels.
The image files were processed through a pattern recognition program (written in Matlab). The program identified single columns, rows and digits from the intensity difference between the white background and dark printed area. Each digit was recognized by the maximum correlation between digit pixels and those of known reference numbers 0-9. As all the numbers in a table were printed usign the same font and font size it was possible to determine the appearances of these reference numbers from the Date column which is the first column in every table. The output of the digitalization program was two simple text files (one file for each table) containing the measured magnetic field values in digital form. In total about 450 000 hourly values of both D and H were digitized.
For several reasons (bad printing quality, degradation, stains, specks, misaligned digits, etc.) the digitalization program could not identify correctly all numbers. The total error percentage was about 1-2. These erronuous readings were caught in visual inspection when the digitized hourly values were plotted against time. The errors then appeared as suspicious single spikes. Furthermore as data from all the four station were plotted simultaneously in a stack plot it was easy to determine whether a single spike was a natural feature which appeared in all magnetograms or an erronuous reading which appeared only in one station's plot. A considerable amount of errors was found to be typing misprints in the original yearbook tables.
To browse the list of digitized data table files and to view their content select the year here:
Time conversion to UT
In the 19th century coordinated magnetic observations were usually made according to Göttingen astronomical time. In an astronomical time system 0h corresponds to noon and 12h is midnight (astronomers started their day at noon as then a night of observing was not split between two different dates). The Göttingen astronomical time is 40 minutes ahead of Greenwich astronomical time. As Greenwich astronomical time lacks 12 hours the modern UT it means that Göttingen astronomical time lacks UT by 11 hours 20 minutes. Therefore 0h in Göttingen astronomical time corresponds to 11h 20min UT.
In the Russian yearbooks analysed in this study the time in hourly observations were given in Göttingen astronomical time for years 1850-1855 (1850-1856 in St. Petersburg). For later years the time was given in local solar time (LT) where 0h corresponds to noon. Using the geographic longitudes of the observatories the local times can be converted to UT. The table below shows the time offsets that should be added to the yearbook hour readings to convert the times to UT.
| Time offsets for conversion to UT | ||
|---|---|---|
| Observatory | 1850-1855 (1850-1856 for STP) |
1856-1862 (1857-1862 for STP) |
| St. Petersburg (STP) | 11h 20m | 9h 59m |
| Ekateringburg (EKA) | 11h 20m | 7h 58m |
| Barnaul (BAR) | 11h 20m | 6h 24m |
| Nertchinsk (NER) | 11h 20m | 4h 02m |
Conversion to nT
At all observatories the magnetic observations were made on the horizontal field (H) and declination (D). Variations in the magnetic field were observed visually from a scale mounted on a telescope through which the sightings of the magnet were made. Each hourly value was of the mean value of five observations at 15 s intervals centered on the full hour. The observed quantity is thus a scale reading (SD, SH) (in 1/24 inches), which is then converted to relative magnetic field values ΔD and ΔH. For D, the formula is| Sensitivity coefficients for conversion to nT | |||||
|---|---|---|---|---|---|
| Observatory | H (nT) at 1859 |
εD(") | εD(nT) = H tan εD(") |
εH(nT) | |
| St. Petersburg (STP) | 15800 | 26.3 | 2.02 | 1.68 | |
| Ekateringburg (EKA) | 18500 | 33.4 | 3.00 | 1.77 | |
| Barnaul (BAR) | 19500 | 32.8 | 3.10 | 2.13 | |
| Nertchinsk (NER) | 21000 | 33.8 | 3.44 | 1.74 | |
Data download
Datafiles for the four observatories and for the years 1850-1862 (1851-1862 for NER) may be downloaded from the table below. The files are simple columnar text files. The first columns specify the year, month, day, hour and minute of the recording and the last two columns give the horizontal intensity (H) and declination (D) (in this order). Missing data values are marked as 'NaN'. There are three versions of the data files:
- Original data. No time shift nor scaling is applied. The times and field values are the same as they appear in the yearbooks.
- UT converted data. Here time is converted into UT according to the procedure explained above. In these files also the minute value of the observation moment is given. Note that due to the change of timing system at the end of 1855 (1856 for STP) the minute value of the observation time changes.
- UT converted and scaled data. Here time is converted into UT and field values are converted into nT's according to equations and coefficients given in the table above. No baselines are added to the field values.
| Datafiles | ||
|---|---|---|
| Original data (no timeshift, no scaling) |
UT converted data (no scaling) |
UT converted and scaled data |
| STP_1850_1862.txt | STP_1850_1862_UT.txt | STP_1850_1862_UT_nT.txt |
| EKA_1850_1862.txt | EKA_1850_1862_UT.txt | EKA_1850_1862_UT_nT.txt |
| BAR_1850_1862.txt | BAR_1850_1862_UT.txt | BAR_1850_1862_UT_nT.txt |
| NER_1851_1862.txt | NER_1851_1862_UT.txt | NER_1851_1862_UT_nT.txt |


