
Examples of HYB simulations
Flying along Venus Express orbit
The HYB model can also be used to obtain a better insight about regions through which a spacecraft might travel. In the video the viewpoint is moving along a true orbit of ESA's Venus Express spacecraft in the Venus plasma environment (http://www.esa.int/Our_Activities/Space_Science/Venus_Express, http://sci.esa.int/venus-express/).
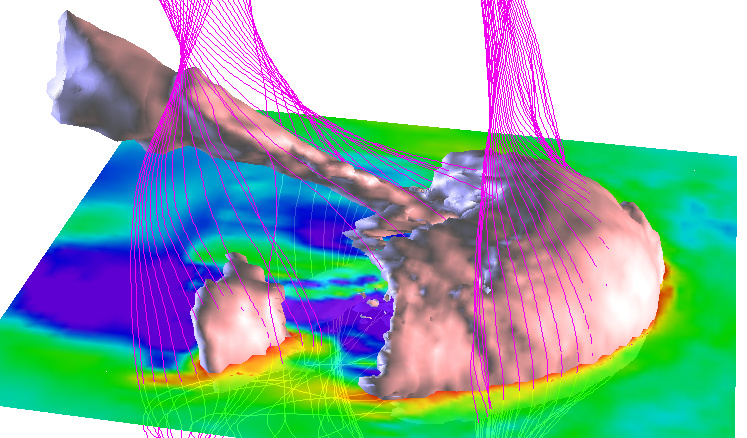
Flying in the induced magnetosphere of Titan
HYB model of Titan's interaction with the co-rotating plasma in the magnetosphere of Saturn. Surface encompasses areas of highest magnetic flux. Orbital plane is shown with colors indicating magnetic flux values. Field lines show the draping of the magnetic field around Titan's ionosphere. (Sillanpää et al.)
Solar storm at Venus
The HYB model can be used to study time dependent phenomena in planetary plasma environments. Video illustrates how the Venus plasma environment is disturbed when it is hit by a space weather disturbance travelling from the Sun. In the simulation the disturbance is a short duration density enhancement in the solar wind. Note how the disturbance "shakes" the whole plasma environment of Venus, triggering in its wake instabilities and turbulence in the plasma, which after some time returns back to an equilibrium state.
Atmospheric erosion at Venus
The HYB model is capable of giving a three dimensional (3D) view of the plasma physical processes at unmagnetized planets and other celestial bodies. Video illustrates how the density of atomic oxygen ions (O+) escaping from Venus would look like at different positions around Venus in the HYB simulation.
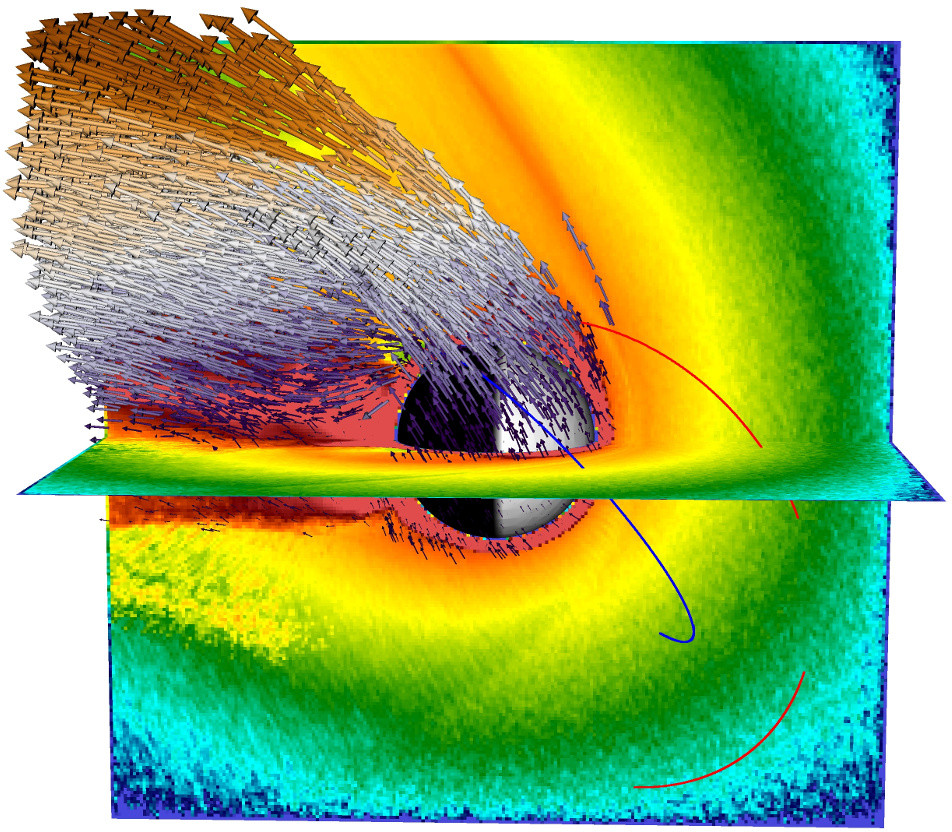
Induced magnetosphere of Titan
Titan's interaction with the co-rotating plasma in the magnetosphere of Saturn. Surface encompasses areas of highest magnetic flux. Orbital plane is shown with colors indicating magnetic flux values. Field lines show the draping of the magnetic field around Titan's ionosphere. (Sillanpää et al.)
Escaping elements of water at Venus
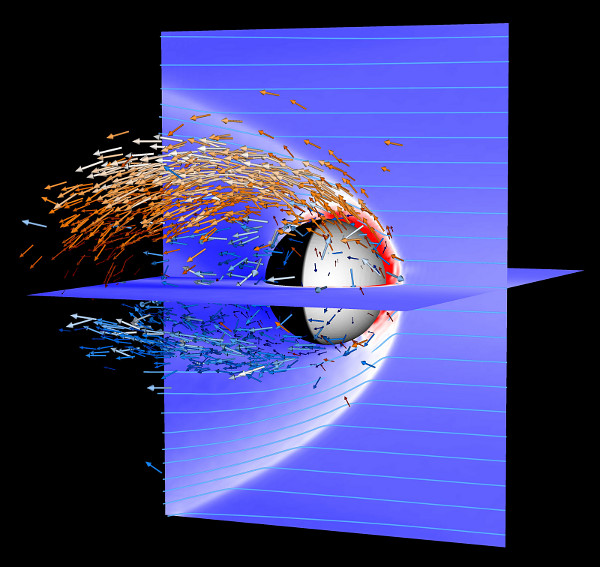
Solar wind driven oxygen (orange arrows) and hydrogen (blue arrows) ion escape from Venus (Jarvinen et al., 2010).
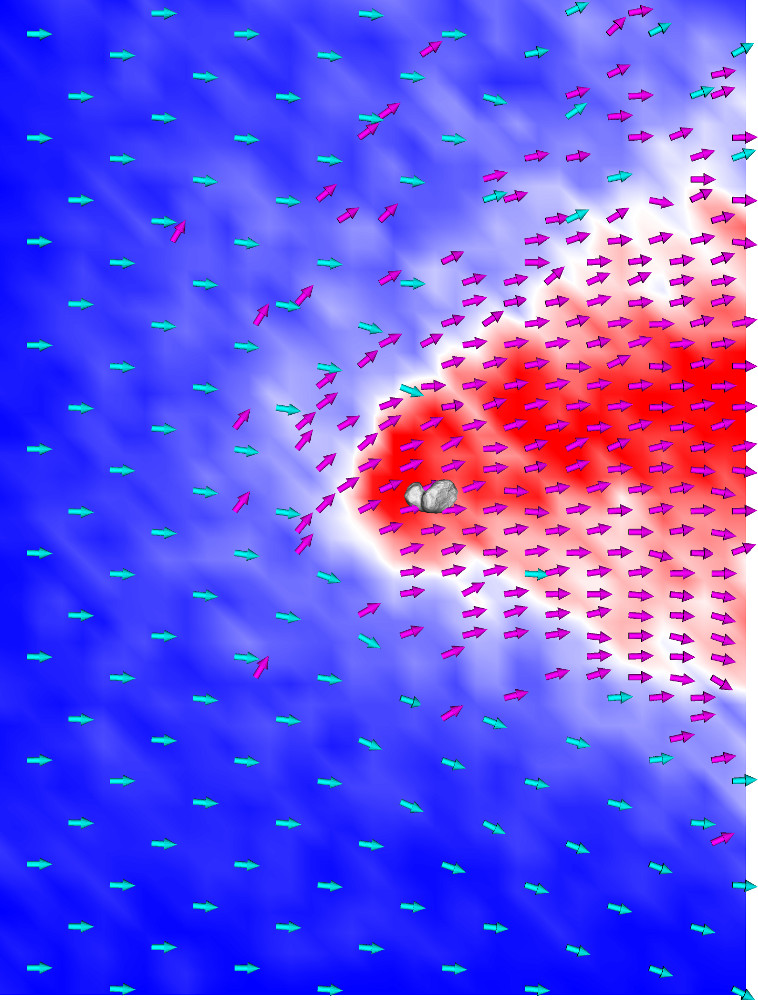
Induced magnetosphere of Venus
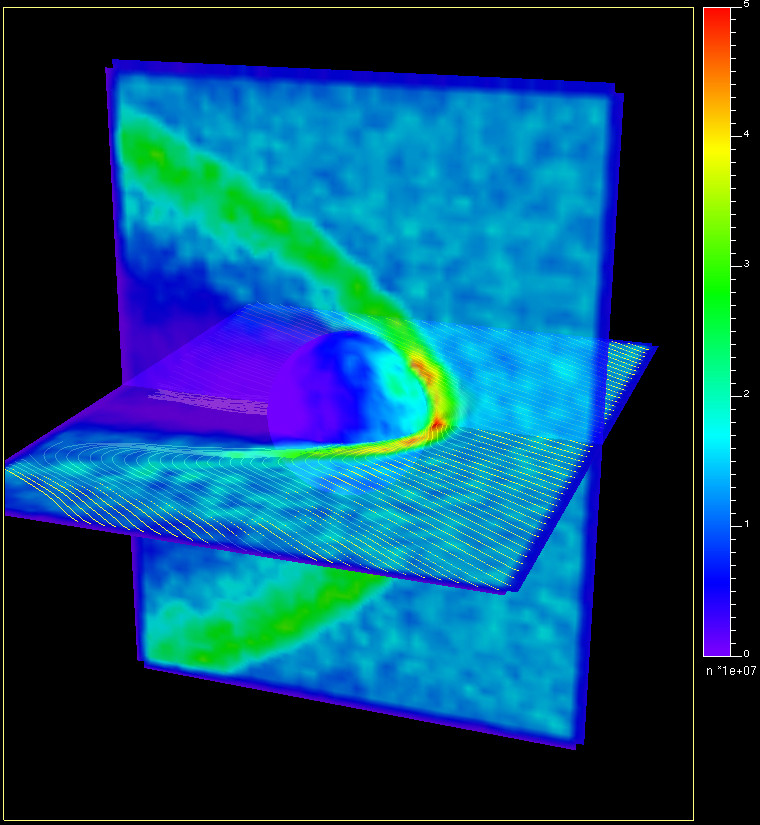
Density of the solar wind protons in the Venusian induced magnetosphere (color coding) showning the bow shock (red-green) and the low density wake and magnetotail of the planet (magenta-blue). Yellow lines illustrate the interplanetary magnetic field (IMF) draping around Venus. See Jarvinen et al. (2009, 2013).
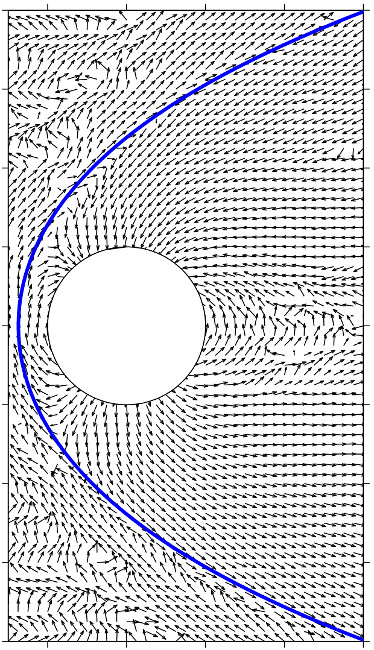
Current system in the Venus magnetotail
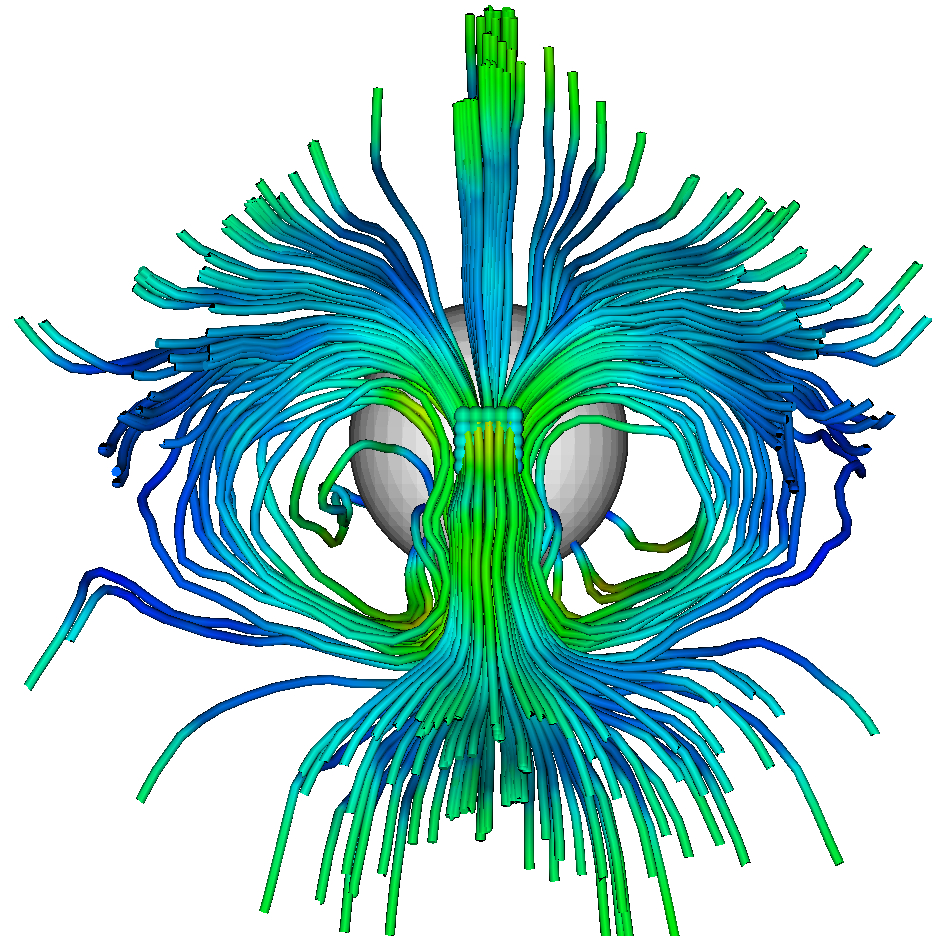
Estimation of the electric current system in the induced magnetotail of Venus. The central tail current sheet (CTCS) points from down to top in the center of the figure and circles symmetrically around the two magnetic lobes of the tail (Jarvinen et al., 2013).
Formation of the ionized gas tail of a comet
Large scale interaction of a comet and the solar wind, which leads to the formation of the cometary ionized gas tail.
Magnetosphere of Mercury
Magnetic field vectors and the bow shock at Mercury (Kallio&Janhunen, 2003).
Magnetic morphology near Venus

Magnetic field line tracing in the Venus induced magnetosphere along the Venus Express orbit (Kallio et al., 2007).
Heavy ion escape from Mars
High resolution parallel modeling of the solar wind driven ion erosion from Mars (Jarvinen&Sandroos, 2013). Sources of the Mars ions are the almost spherically symmetric exosphere and the ionosphere.
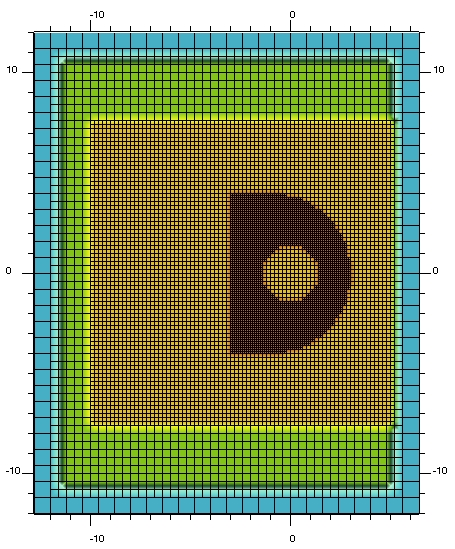
Grid refinements
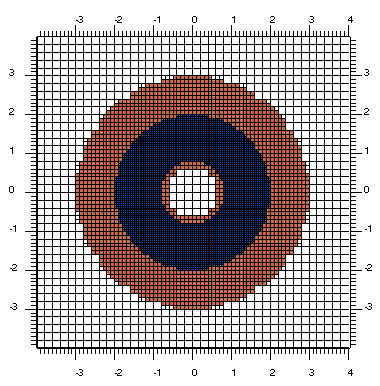
Hierarchically refined Cartesian 3-level mesh.
Grid refinements
Hierarchically refined Cartesian 4-level mesh.
Constant grid
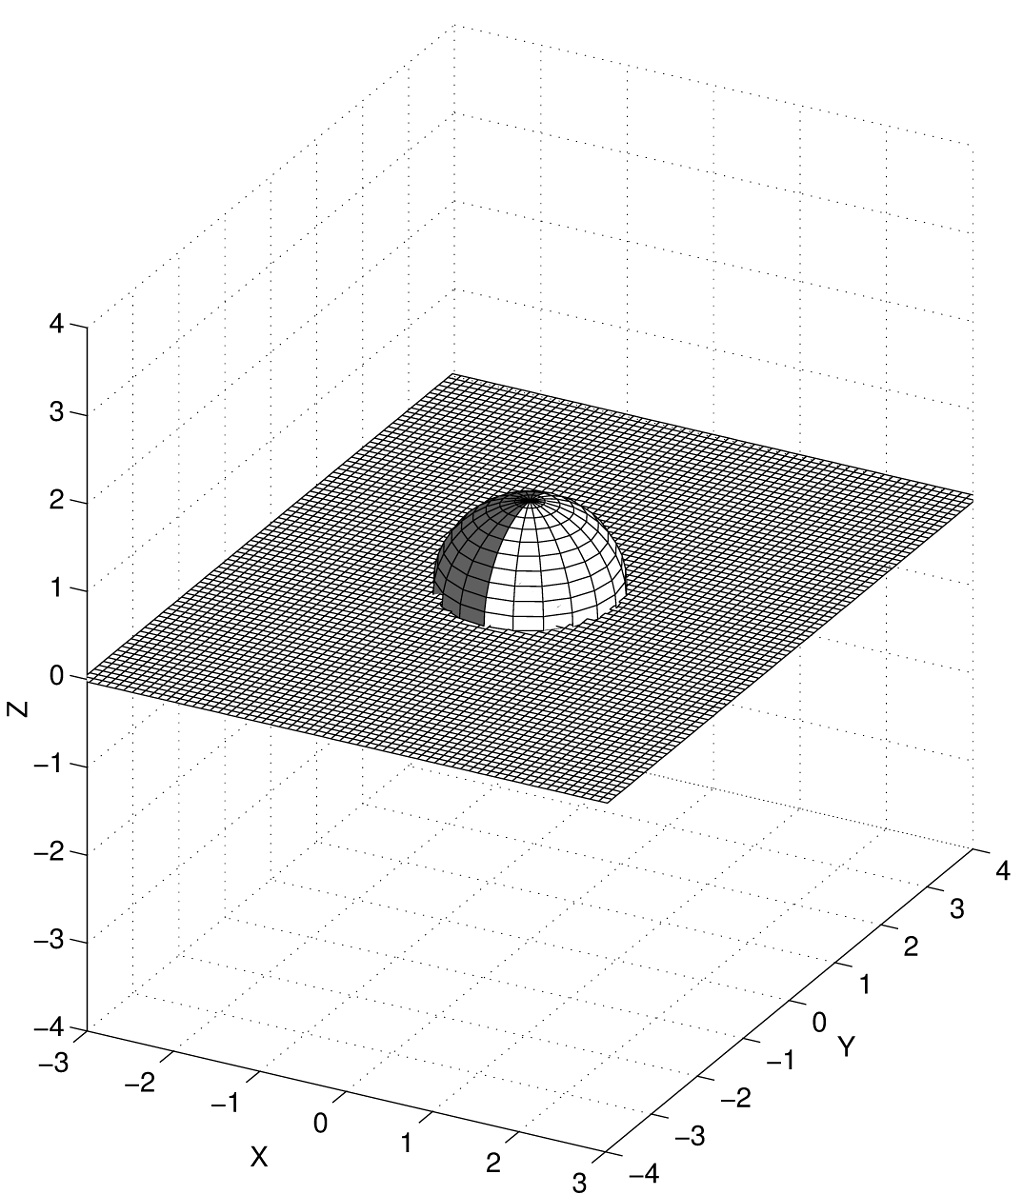
Mesh with a constant grid cell size.
Ion time-energy spectrogram
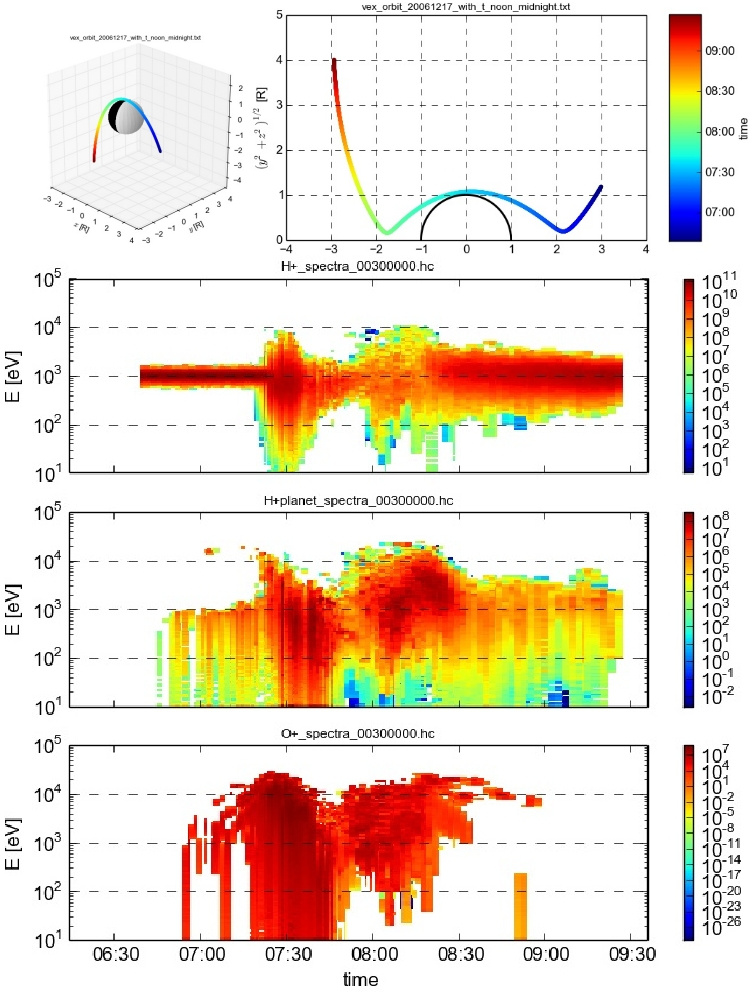
Ion time-energy spectrograms of H+ (solar wind), H+ (planetary) and O+ (planetary) ions along the Venus Express trajectory in the HYB simulation.
Hybrid Web Archive analysis tool
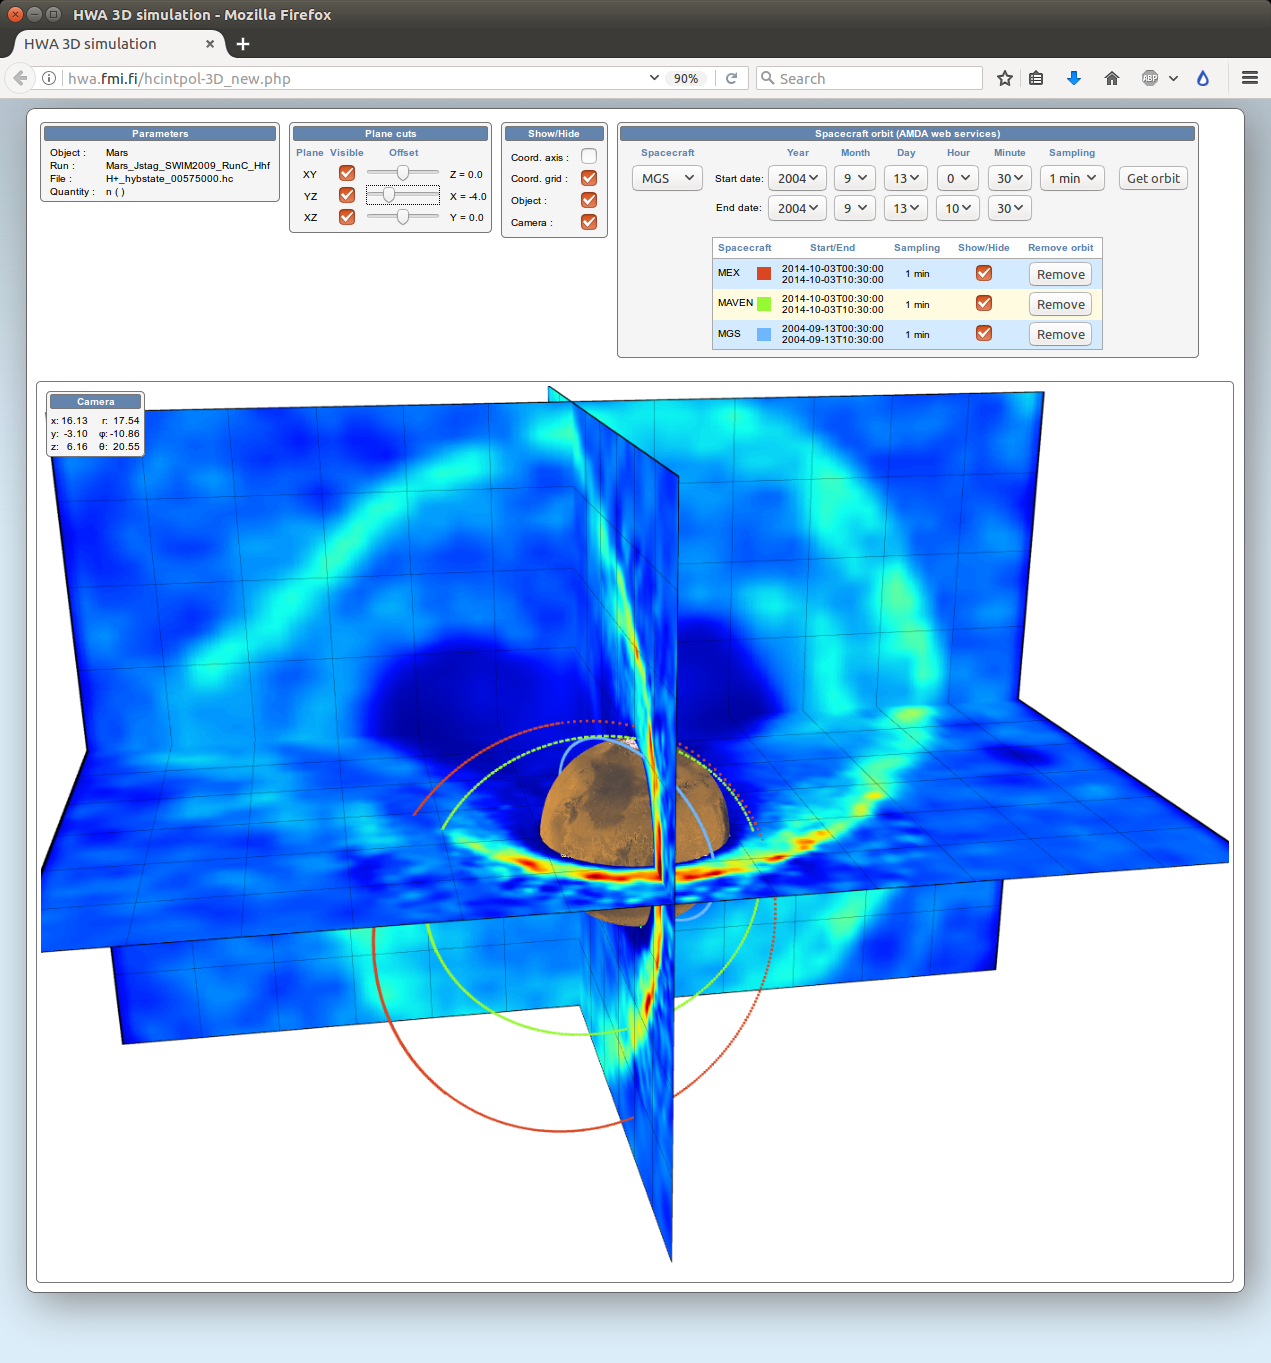
Analysis of a HYB-Mars simulation run on the Hybrid Web Archive (HWA) website, which can be accesse at hwa.fmi.fi.