
FMI All-Sky Cameras: Creating keograms
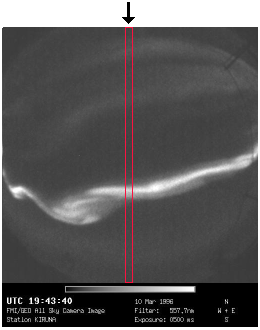
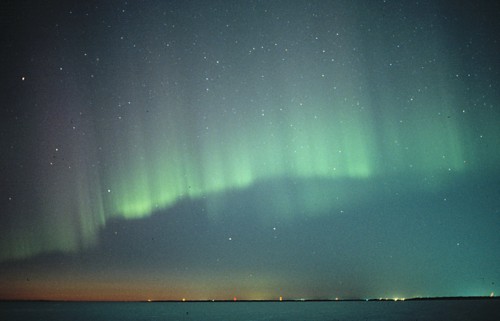
Keograms are used in analysing auroral phenomena. They are created by extracting vertical pixel columns from individual all-sky images and putting the columns side by side. The horizontal axis is the time and the vertical axis is the geographical latitude. This is demonstrated on the left.
The name keogram comes from keoitt - an old Eskimoan word which means aurora borealis.
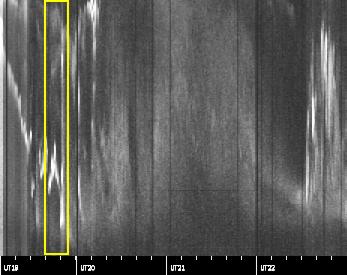
For example, in the keogram shown below one can easily detect a
southward moving bright arc beginning at UT1900. This is typical for
the growth phase of a substorm. Just before UT2000 the
whole vertical line is filled with aurora, which indicates a
break-up. After about 30 minutes things calm down
which seems to start the recovery phase.
Thus, without any additional knowledge one can detect a substorm between UT1900-2100 and then perhaps create a suitable Quicktime movie (2MB) from the images between UT1940 and UT1952 for further analysis (the yellow rectangle in the keogram).
 Do you detect more than one substorm?
More information: Kirsti Kauristie
e-mail: firstname.lastname@fmi.fi