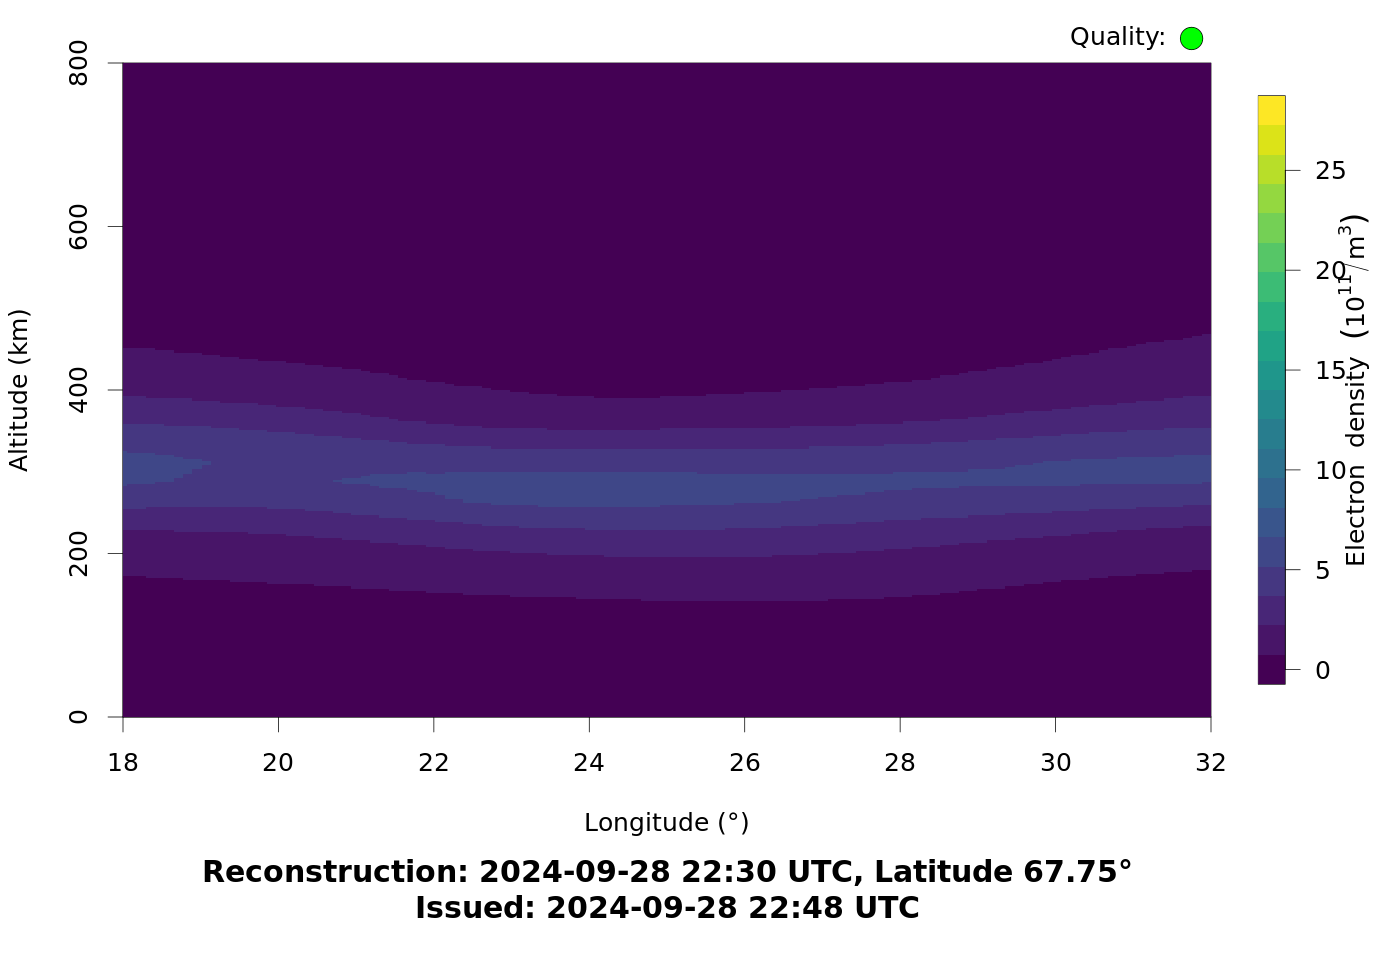
Slice of electron density distribution in a longitude-altitude plot along the latitude (67.75° N) of the analysis area. The colored symbol in top right corner
describes the quality of the inversion: Green dot = nominal, Orange square = no a priori
information available by ionosondes, Red triangle = data from less than 5 GNSS receiver
stations available above 65° N or less than 50 receivers in total.
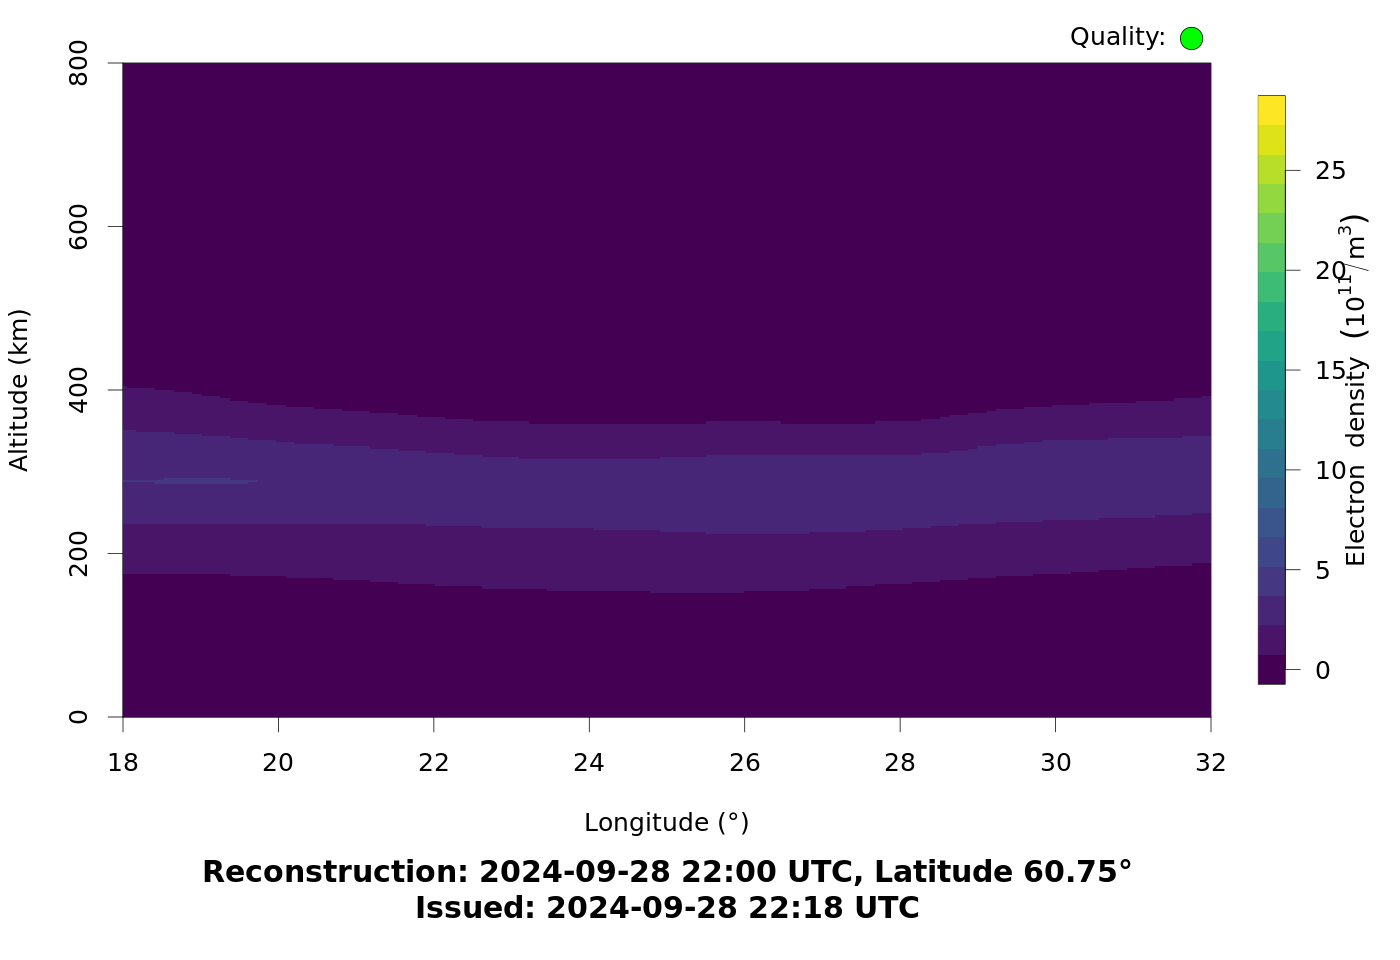
Slice of electron density distribution in a longitude-altitude plot along the latitude (60.75° N) of the analysis area. The colored symbol in top right corner
describes the quality of the inversion: Green dot = nominal, Orange square = no a priori
information available by ionosondes, Red triangle = data from less than 5 GNSS receiver
stations available above 65° N or less than 50 receivers in total.
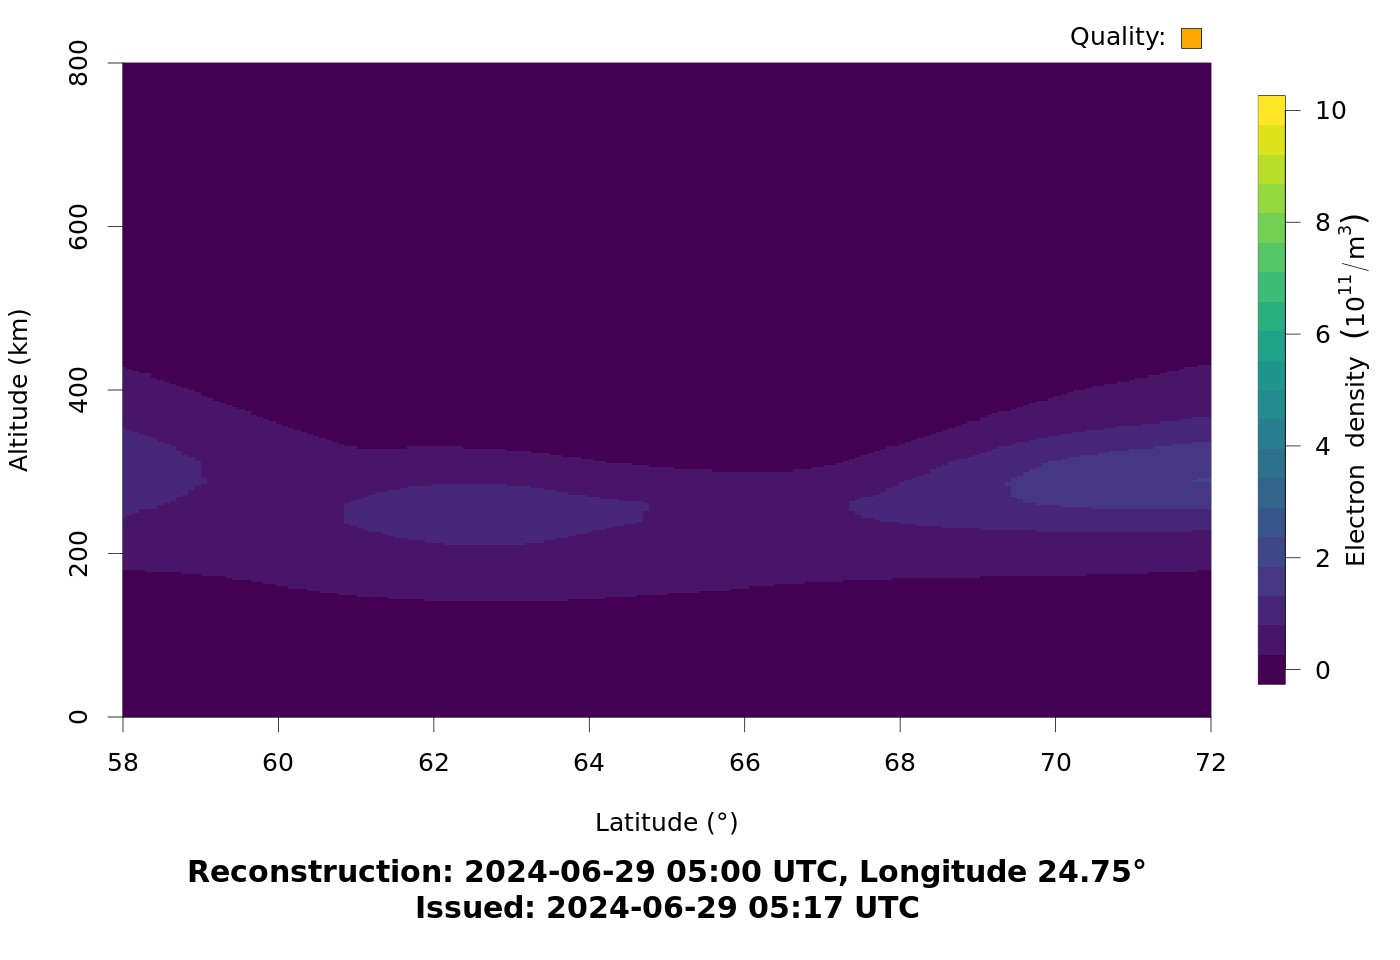
Slice of electron density distribution in a latitude-altitude plot along the centre longitude (24.75° E) of the analysis area. The colored symbol in top right corner
describes the quality of the inversion: Green dot = nominal, Orange square = no a priori
information available by ionosondes, Red triangle = data from less than 5 GNSS receiver
stations available above 65° N or less than 50 receivers in total.
TomoScand 2D
The TomoScand2D product shows three slices from the TomoScand3D product. One of the slices shows electron density distribution in a latitude-altitude plot along the centre longitude (24.75 deg E) of the analysis area. The two other plots show longitude-altitude cuts along two constant latitudes, one under the auroral zone (67.75 deg N) and one at sub-auroral region (60.75 deg).
The reference coordinate system is WGS84.