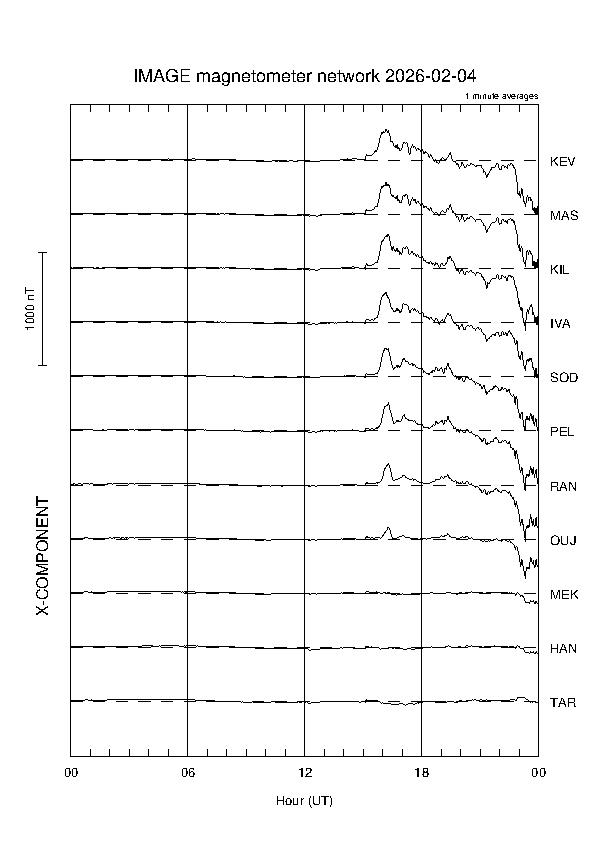
Preliminary magnetograms of last 30 days
These plots are only for quick-look purposes! Data are not checked, error spikes, missing values, and timing errors are possible. Final data on-line: http://space.fmi.fi/image/www/?page=online.
Select the date and component
20260204 X Y Z20260203 X Y Z
20260202 X Y Z
20260201 X Y Z
20260131 X Y Z
20260130 X Y Z
20260129 X Y Z
20260128 X Y Z
20260127 X Y Z
20260126 X Y Z
20260125 X Y Z
20260124 X Y Z
20260123 X Y Z
20260122 X Y Z
20260121 X Y Z
20260120 X Y Z
20260119 X Y Z
20260118 X Y Z
20260117 X Y Z
20260116 X Y Z
20260115 X Y Z
20260114 X Y Z
20260113 X Y Z
20260112 X Y Z
20260111 X Y Z
20260110 X Y Z
20260109 X Y Z
20260108 X Y Z
20260107 X Y Z
20260106 X Y Z
Data from Finnish sites are provided by the Finnish Meteorological Institute and the Sodankylä Geophysical Observatory (University of Oulu). Station MAS in Norway is maintained in co-operation with the University of Tromsø, and station TAR in Estonia in co-operation with the Tartu Observatory. Data files are transfered daily to FMI and this page is prepared automatically. Some sites may be occasionally missing in the plots due to different reasons (e.g. problems in connections).
Updated: 24.07.2023 - AV


