
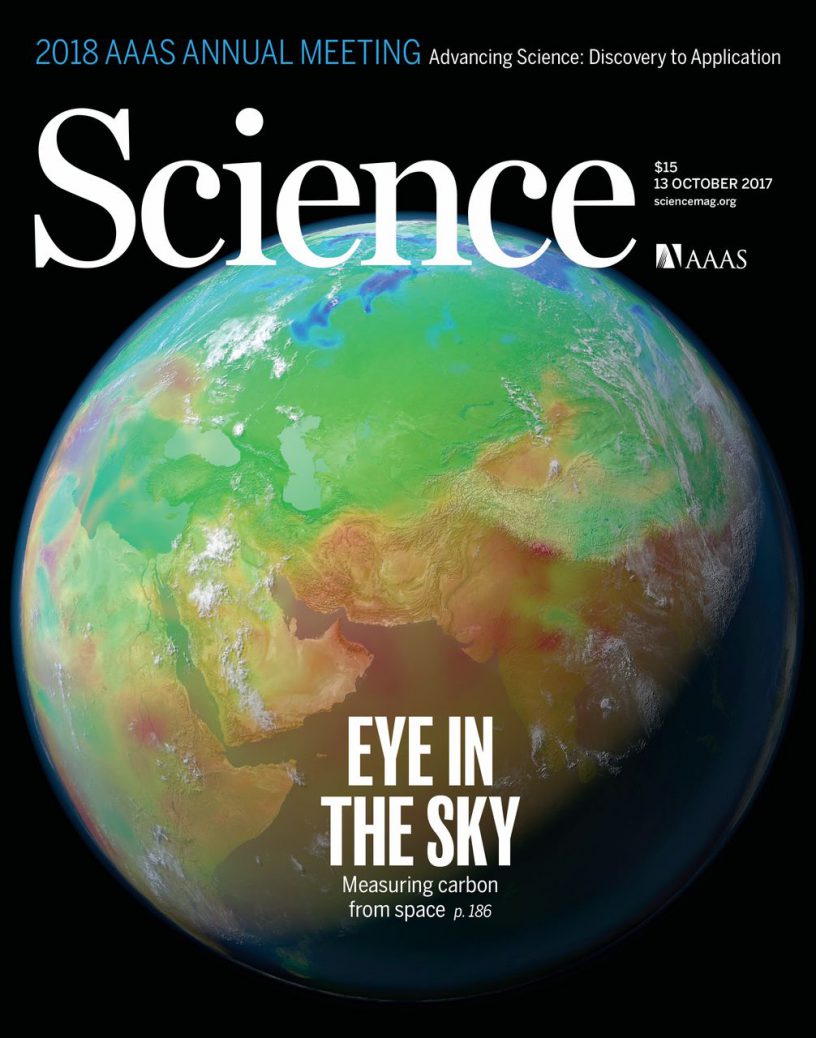
NASA’ s OCO-2 satellite has measured carbon sources and sinks and changes in them globally and with higher precision than before. The carbon dioxide observations made by the OCO-2 satellite can also be used in the geographical mapping of the sources of anthropogenic carbon dioxide. The prestigious journal Science published a special issue consisting of five articles on the OCO-2 (Orbiting Carbon Observatory-2) satellite launched by NASA in 2014. These articles tell us about the first scientific results obtained with the OCO-2 measurement device. Researchers from the Finnish Meteorological Institute participated in writing the article The Orbiting Carbon Observatory-2 early science investigations of regional carbon dioxide fluxes. The work has been funded by the Academy of Finland INQUIRE and CARB-ARC projects.
The first measurements made by NASA’s OCO-2 (Orbiting Carbon Observatory-2) satellite have provided new and more comprehensive data on the regional distribution of carbon dioxide in the atmosphere. Data has also been obtained both on the changes in the carbon dioxide concentrations in different parts of the tropics caused by the El Niño weather phenomenon and on the seasonal variation of carbon dioxide, which is caused by the beginning growing season in spring.
Information on regional distribution of carbon dioxide
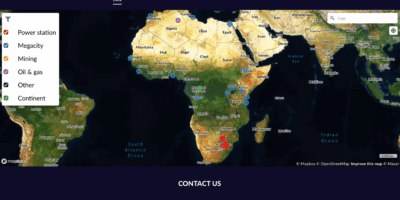
The global data on carbon sources, carbon sinks and their changes obtained from the satellite support climate research and thus help in the mitigation of climate change and in adaptation to it. In terms of research, the extensive geographical coverage of the measurements of OCO-2 has been important as it has enabled analyses of anthropogenic sources on regional scales and the detection of, for example, carbon dioxide emissions caused by biomass burning – trees, bushes and grass – in Africa and Indonesia.
The research results are based on the considerably better precision of the OCO-2 satellite compared with earlier measurement devices as well as on the good geographical coverage of the data. By using the scattering of sunlight from the earth’s surface, the OCO-2 satellite conducts 100,000 good-quality measurements per day in cloudless conditions. This measurement method also provides data on the lower layers of the atmosphere and is thus an essential factor in the research on the sources and sinks of carbon dioxide.
OCO-2 made regional observations about anthropogenic carbon dioxide emissions
The mapping of anthropogenic emissions sources from space is challenging because of the long atmospheric lifetime of carbon dioxide and its great seasonal variation and growth from year to year. The Finnish Meteorological Institute FMI developed a straight-forward method for determining emissions sources on regional scales.
“The method developed at the FMI is based on observed deviations in carbon dioxide concentrations on the scale of continents. These deviations can then be combined for a longer time period. That way it was possible to distinguish emissions sources from the natural variation of carbon dioxide,” explains Researcher Janne Hakkarainen from the FMI. This small innovation brought great added value to the mission that has a total budget of about USD 250 million.
https://www.youtube.com/watch?time_continue=33&v=Px4v_ANp4sg
The YouTube video made by Science Museum of Virginia explains in a straightforward manner the principle that the method developed by the FMI for the determination of carbon dioxide sources on regional scales is based on.
The impact of El Niño on the atmospheric carbon dioxide concentrations detected
The OCO-2 satellite was launched into space on 2 July 2014 and it has been providing observations about carbon dioxide since September 2014. The time point of the launch was fortunate as it made it possible to conduct research on the impacts of the strong El Niño in 2015–2016. Because of El Niño, the increase in carbon dioxide was indeed particularly strong in 2015, about 3 ppm, while the total amount of carbon dioxide in the atmosphere is 400 ppm and its increase has recently been about 2 ppm per year (one ppm corresponds to a part per million). According to the studies conducted, more carbon was released in Africa, South-America and Southeast Asia. With the help of the satellite measurements, it was possible to divide the tropics into regions based on the continents instead of handling the whole tropics as one large area.
Further information:
Finnish Meteorological Institute
Researcher Janne Hakkarainen, tel. +358 45 124 0257, janne.hakkarainen@fmi.fi
Research Professor Johanna Tamminen, tel. +358 40 737 8733, johanna.tamminen@fmi.fi
In addition, Research Professor Jari Liski answers questions related to carbon resources in vegetation and soil, tel. +358 29 539 6086, jari.liski@fmi.fi
NASA
Annmarie Eldering, OCO-2 Deputy Project Scientist, NASA Jet Propulsion Laboratory, annmarie.eldering@jpl.nasa.gov

Leave a Reply
You must be logged in to post a comment.