
In Wednesday, on 7th November, the third satellite in the EUMETSAT Metop satellite series was launched. It will produce data for atmospheric, marine and land coverage monitoring and research as well as continue of the data series of Metop-A and B satellites. FMI is leading the AC SAF project which use IASI and GOME-2 instruments onboard the Metop satellites.
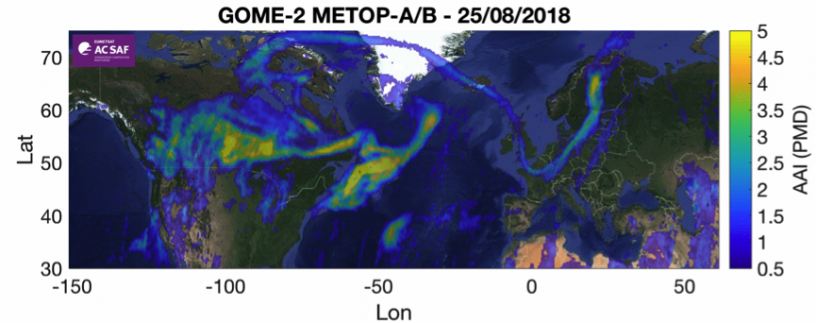
The first satellite, Metop-A, was launched in 2007. The GOME-2 and IASI instruments onboard of this satellite have measured gas components, aerosols and radiation of atmosphere since then. These products have been used to monitor ozone depletion and minor trace gases affecting to depletion and anthropogenic and forest fire emissions effects to air quality, and in monitoring of UV radiation and emissions from volcanic eruptions and forest fires, for example. The products are used also as input to atmospheric models. The next satellite, Metop-B, was launched in 2012 and after that, there has been four instruments measuring atmospheric composition.
“This is an unusually long campaign and shows the determination and knowhow what we have in Europe”, says AC SAF project manager Seppo Hassinen. The Metop platform and it’s operations are funded by the EUMETSAT and it’s member states. EUMETSAT was founded in 1986 and it’s main purpose is to produce satellite data and images for meteorological services and research institutions of it’s member states. The AC SAF project is part of the EUMETSAT ground segment by developing, processing and disseminating GOME-2 and IASI products, and by providing user services.
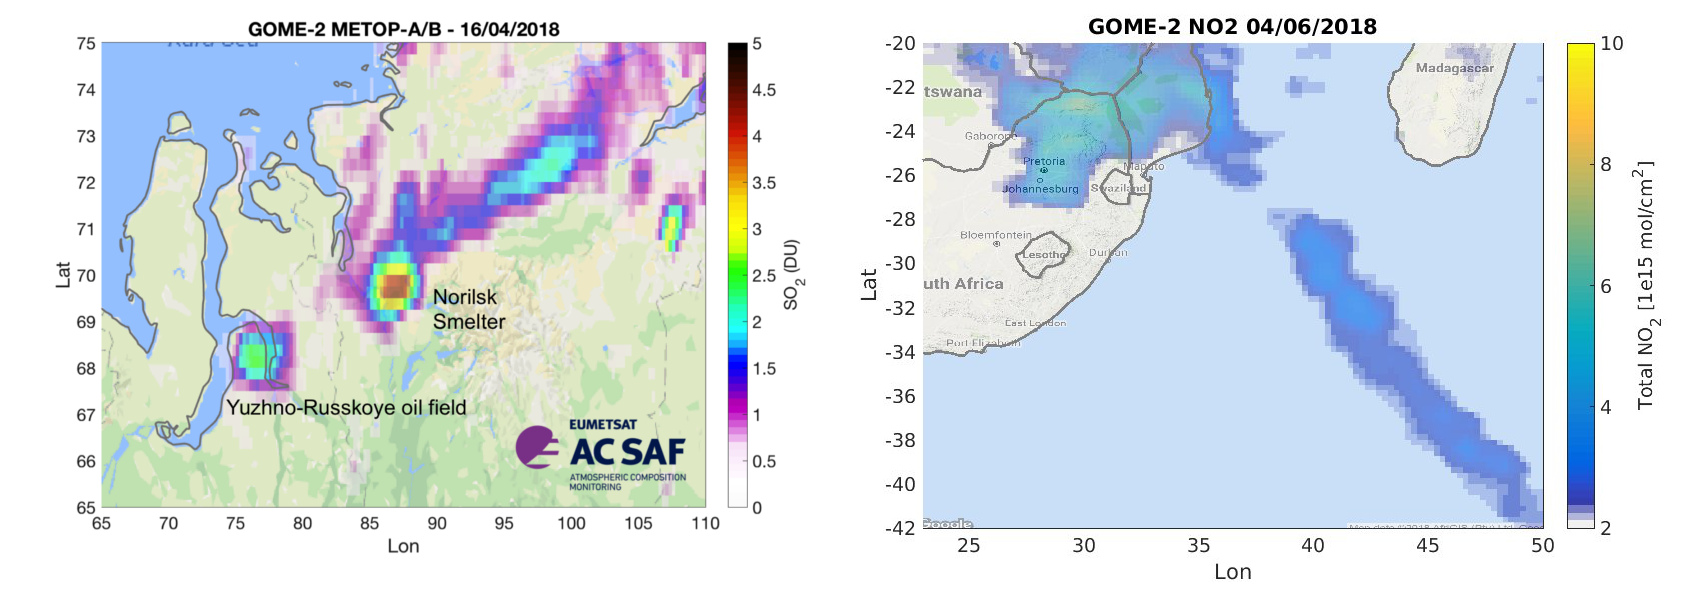
Industrial emissions can be followed with GOME-2 instrument. The SO2 emissions from the Norilsk metal smelter and oil production areas nearby are on left. The NO2 is produced by traffic and energy production (coal plants) and it affects to air quality. Such an example is on right where high NO2 values can be seen over southern Africa and spreading over sea due to wind transportation.
EUMETSAT Metop-C pages including video: https://www.eumetsat.int/website/home/MetopCLaunch/Status/index.html
AC SAF Twitter account shoving examples of data usage: @Atmospheric_SAF

Leave a Reply
You must be logged in to post a comment.